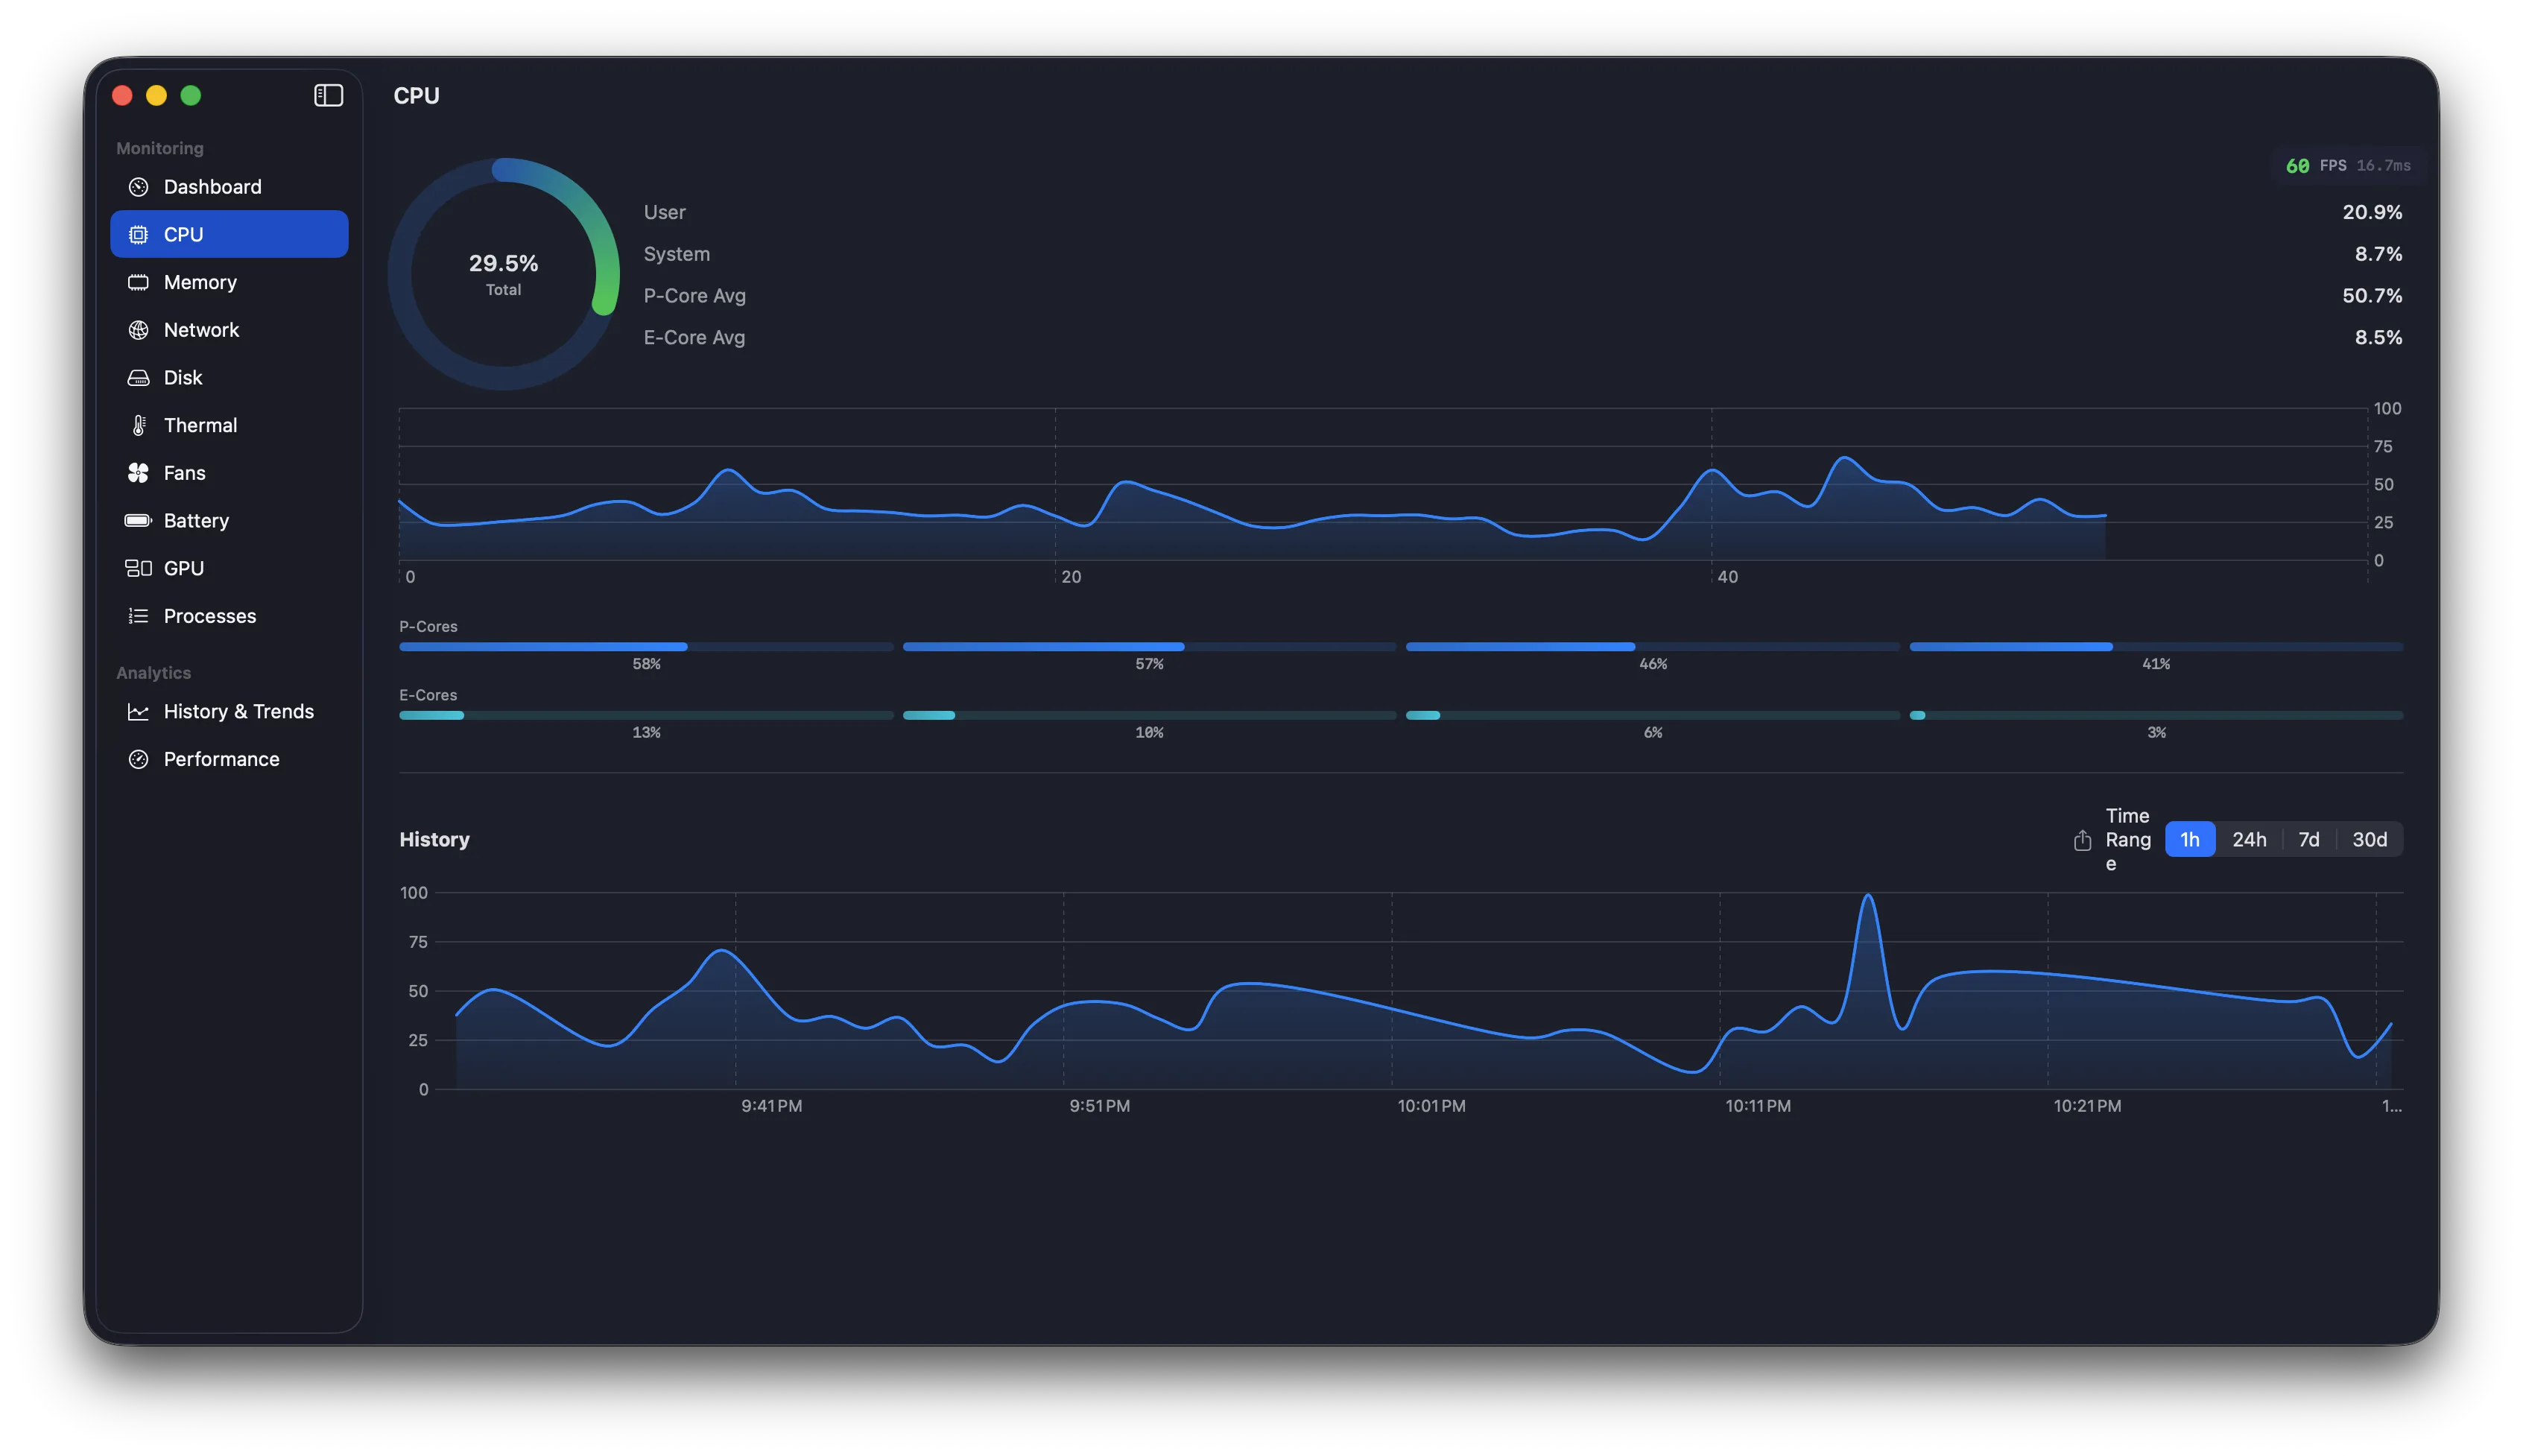
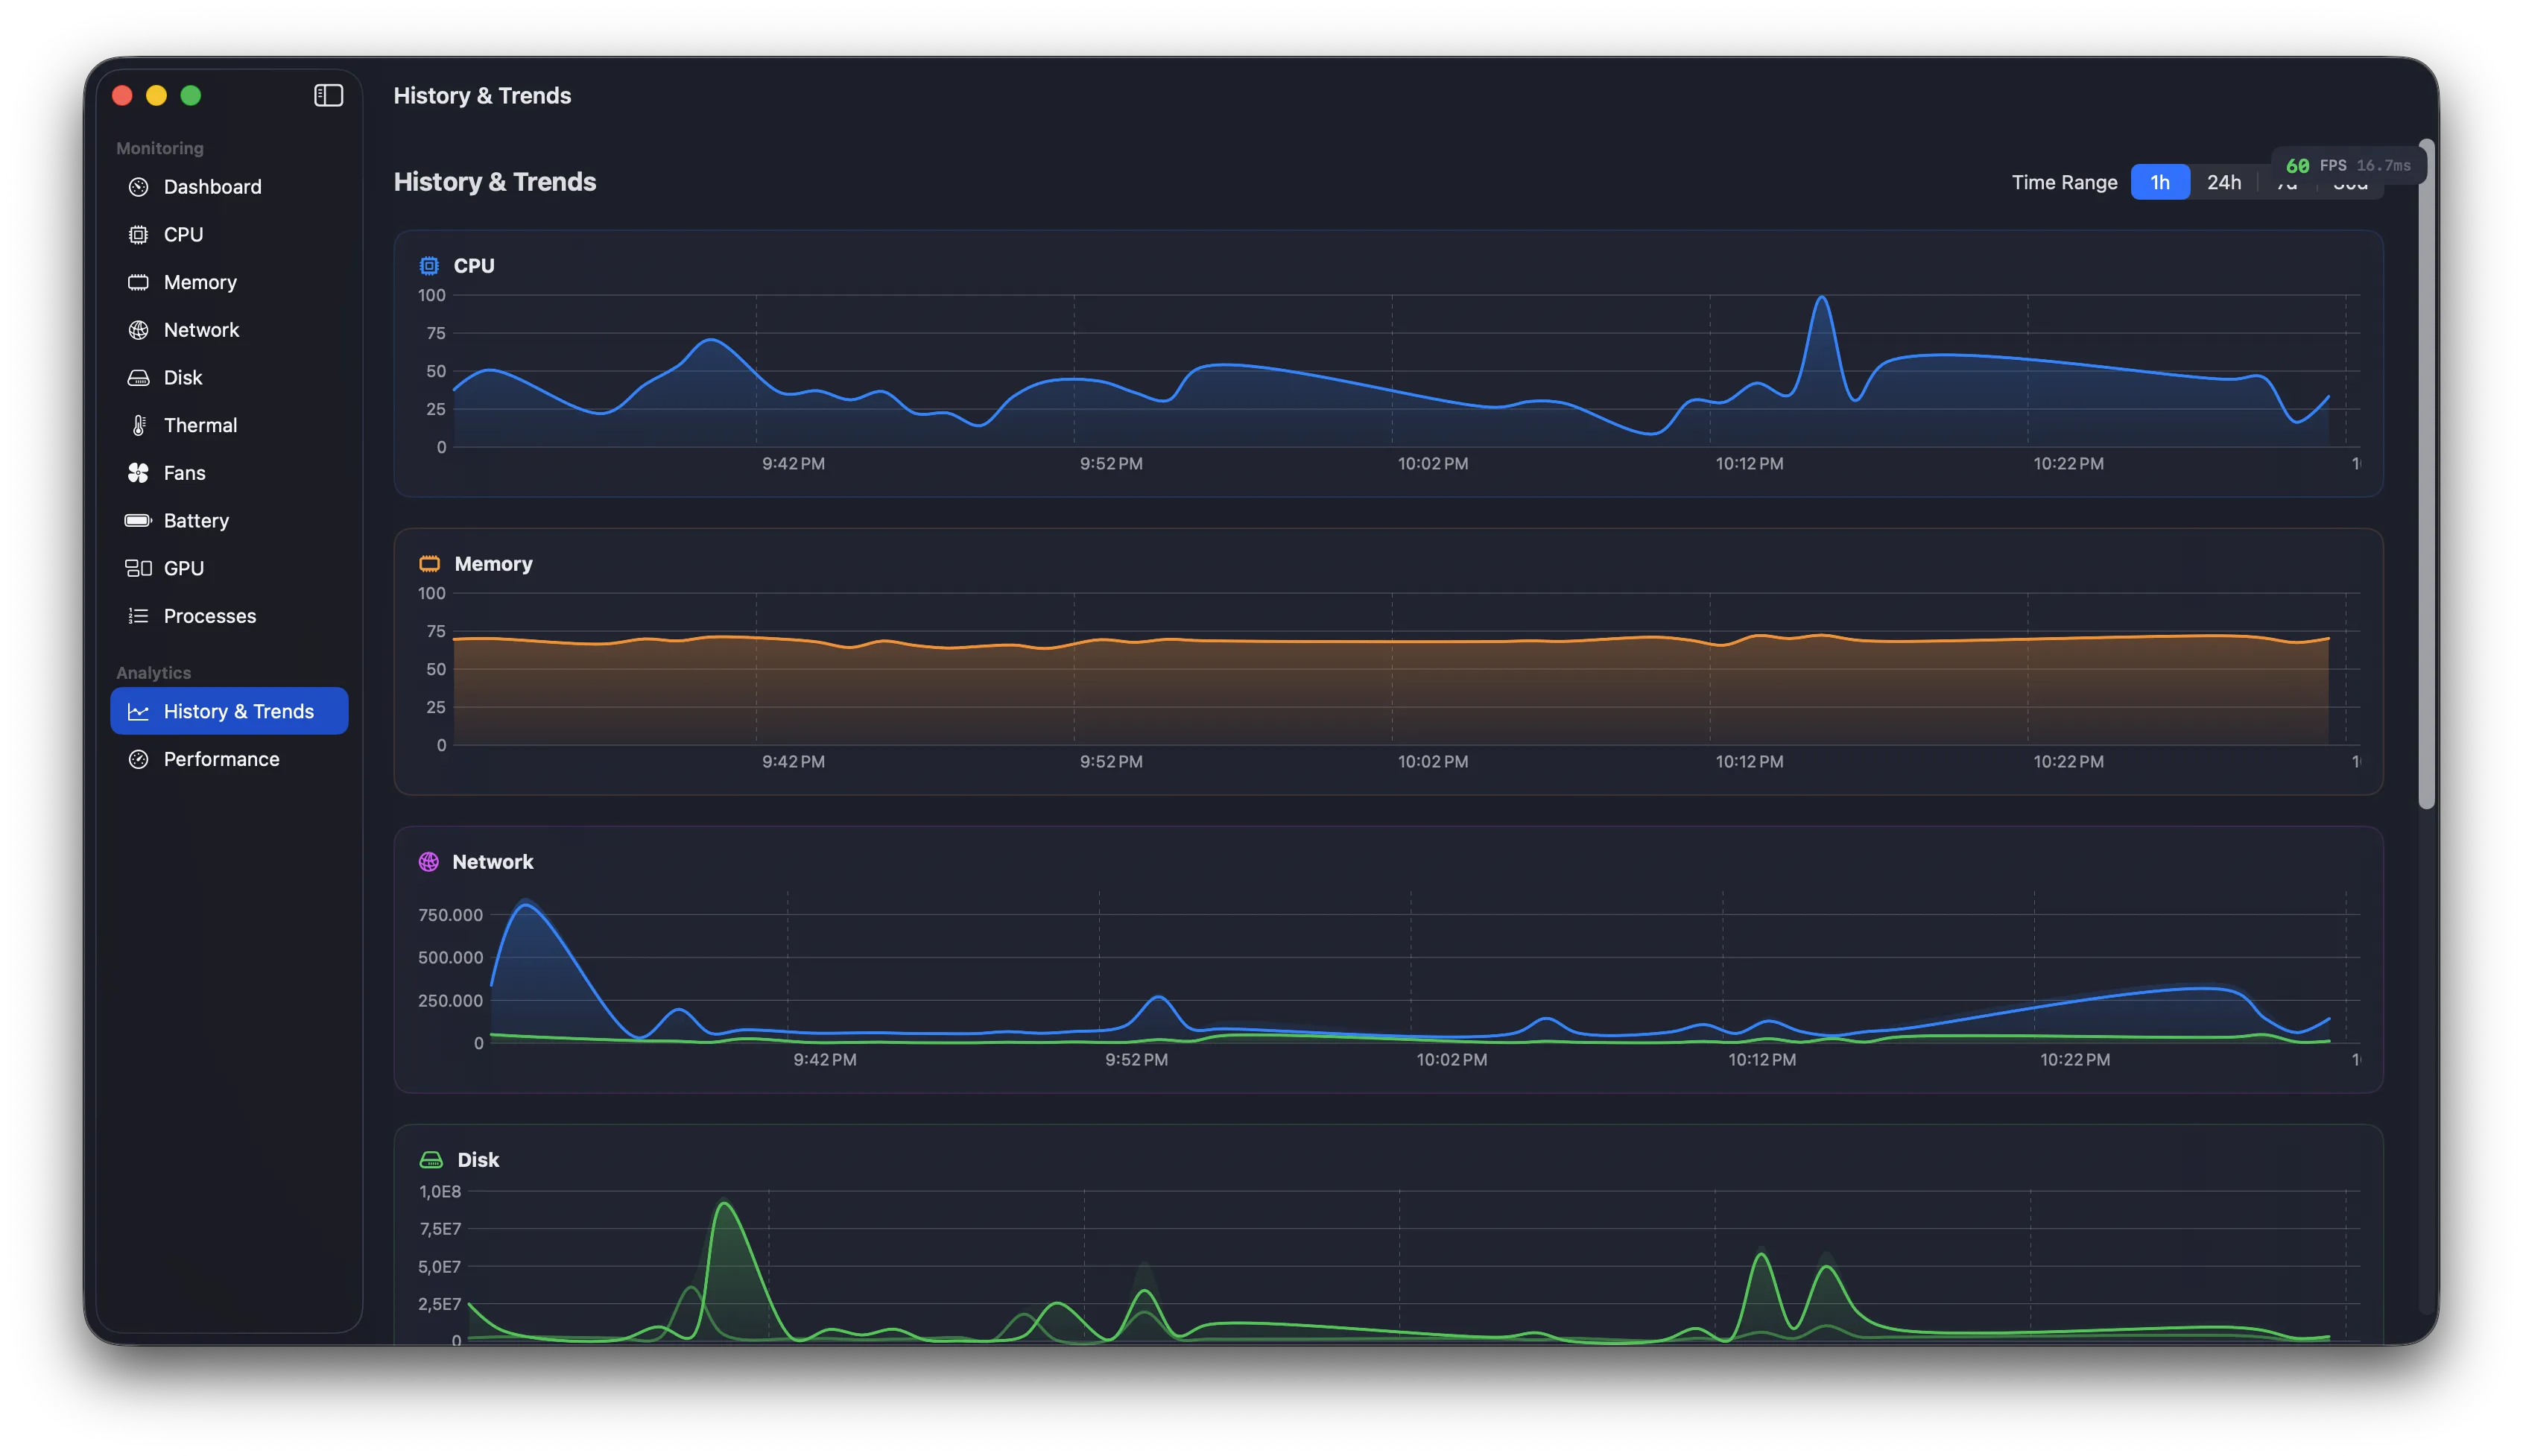
Historical Analytics
Trends over time
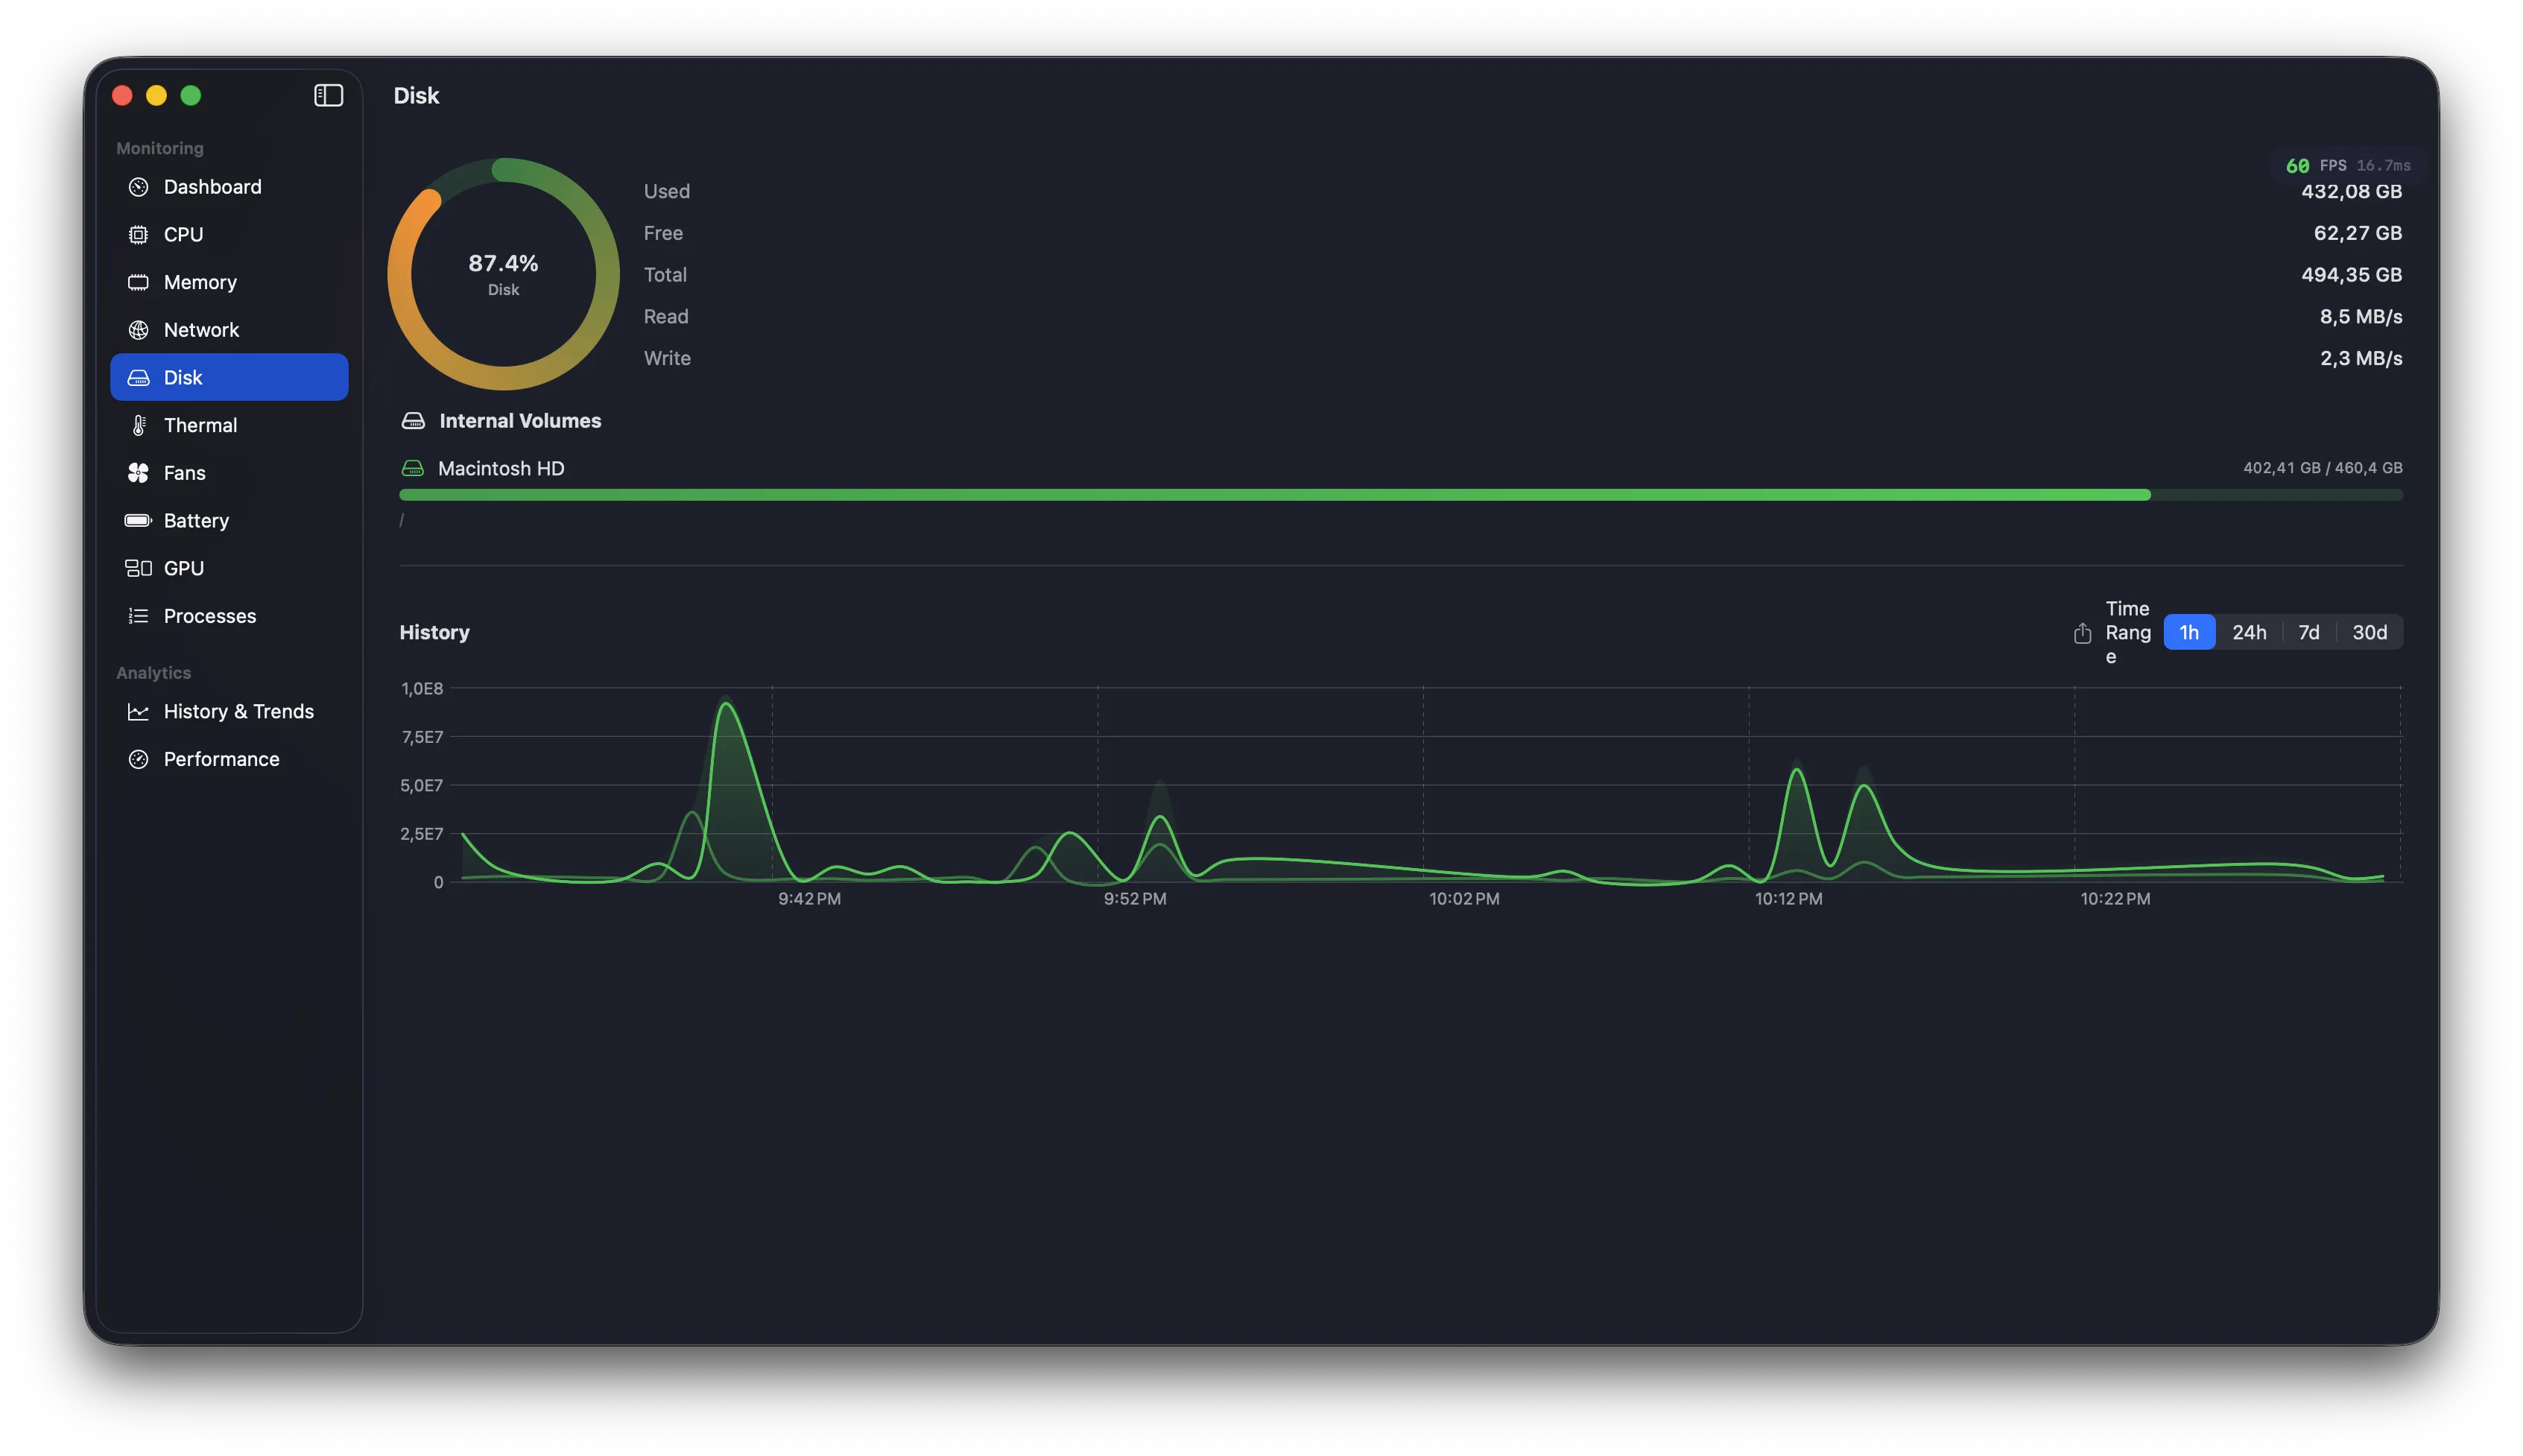
Every data point persisted to SQLite. Browse 24 hours, 7 days, or 30 days of history with intelligent downsampling.
Menu Bar Status Item
Always there
Four display modes: Icon Only, Text, Sparkline, or Text + Sparkline. Show CPU, Memory, or Network speeds directly in your menu bar with mini polyline charts.
Fan Control
Custom curves
Drag control points to create your perfect fan profile. Four presets included.
WidgetKit
Desktop widgets
Small, medium, and large widgets showing system averages. Updated every 5 minutes with averaged data for a meaningful picture of system health.
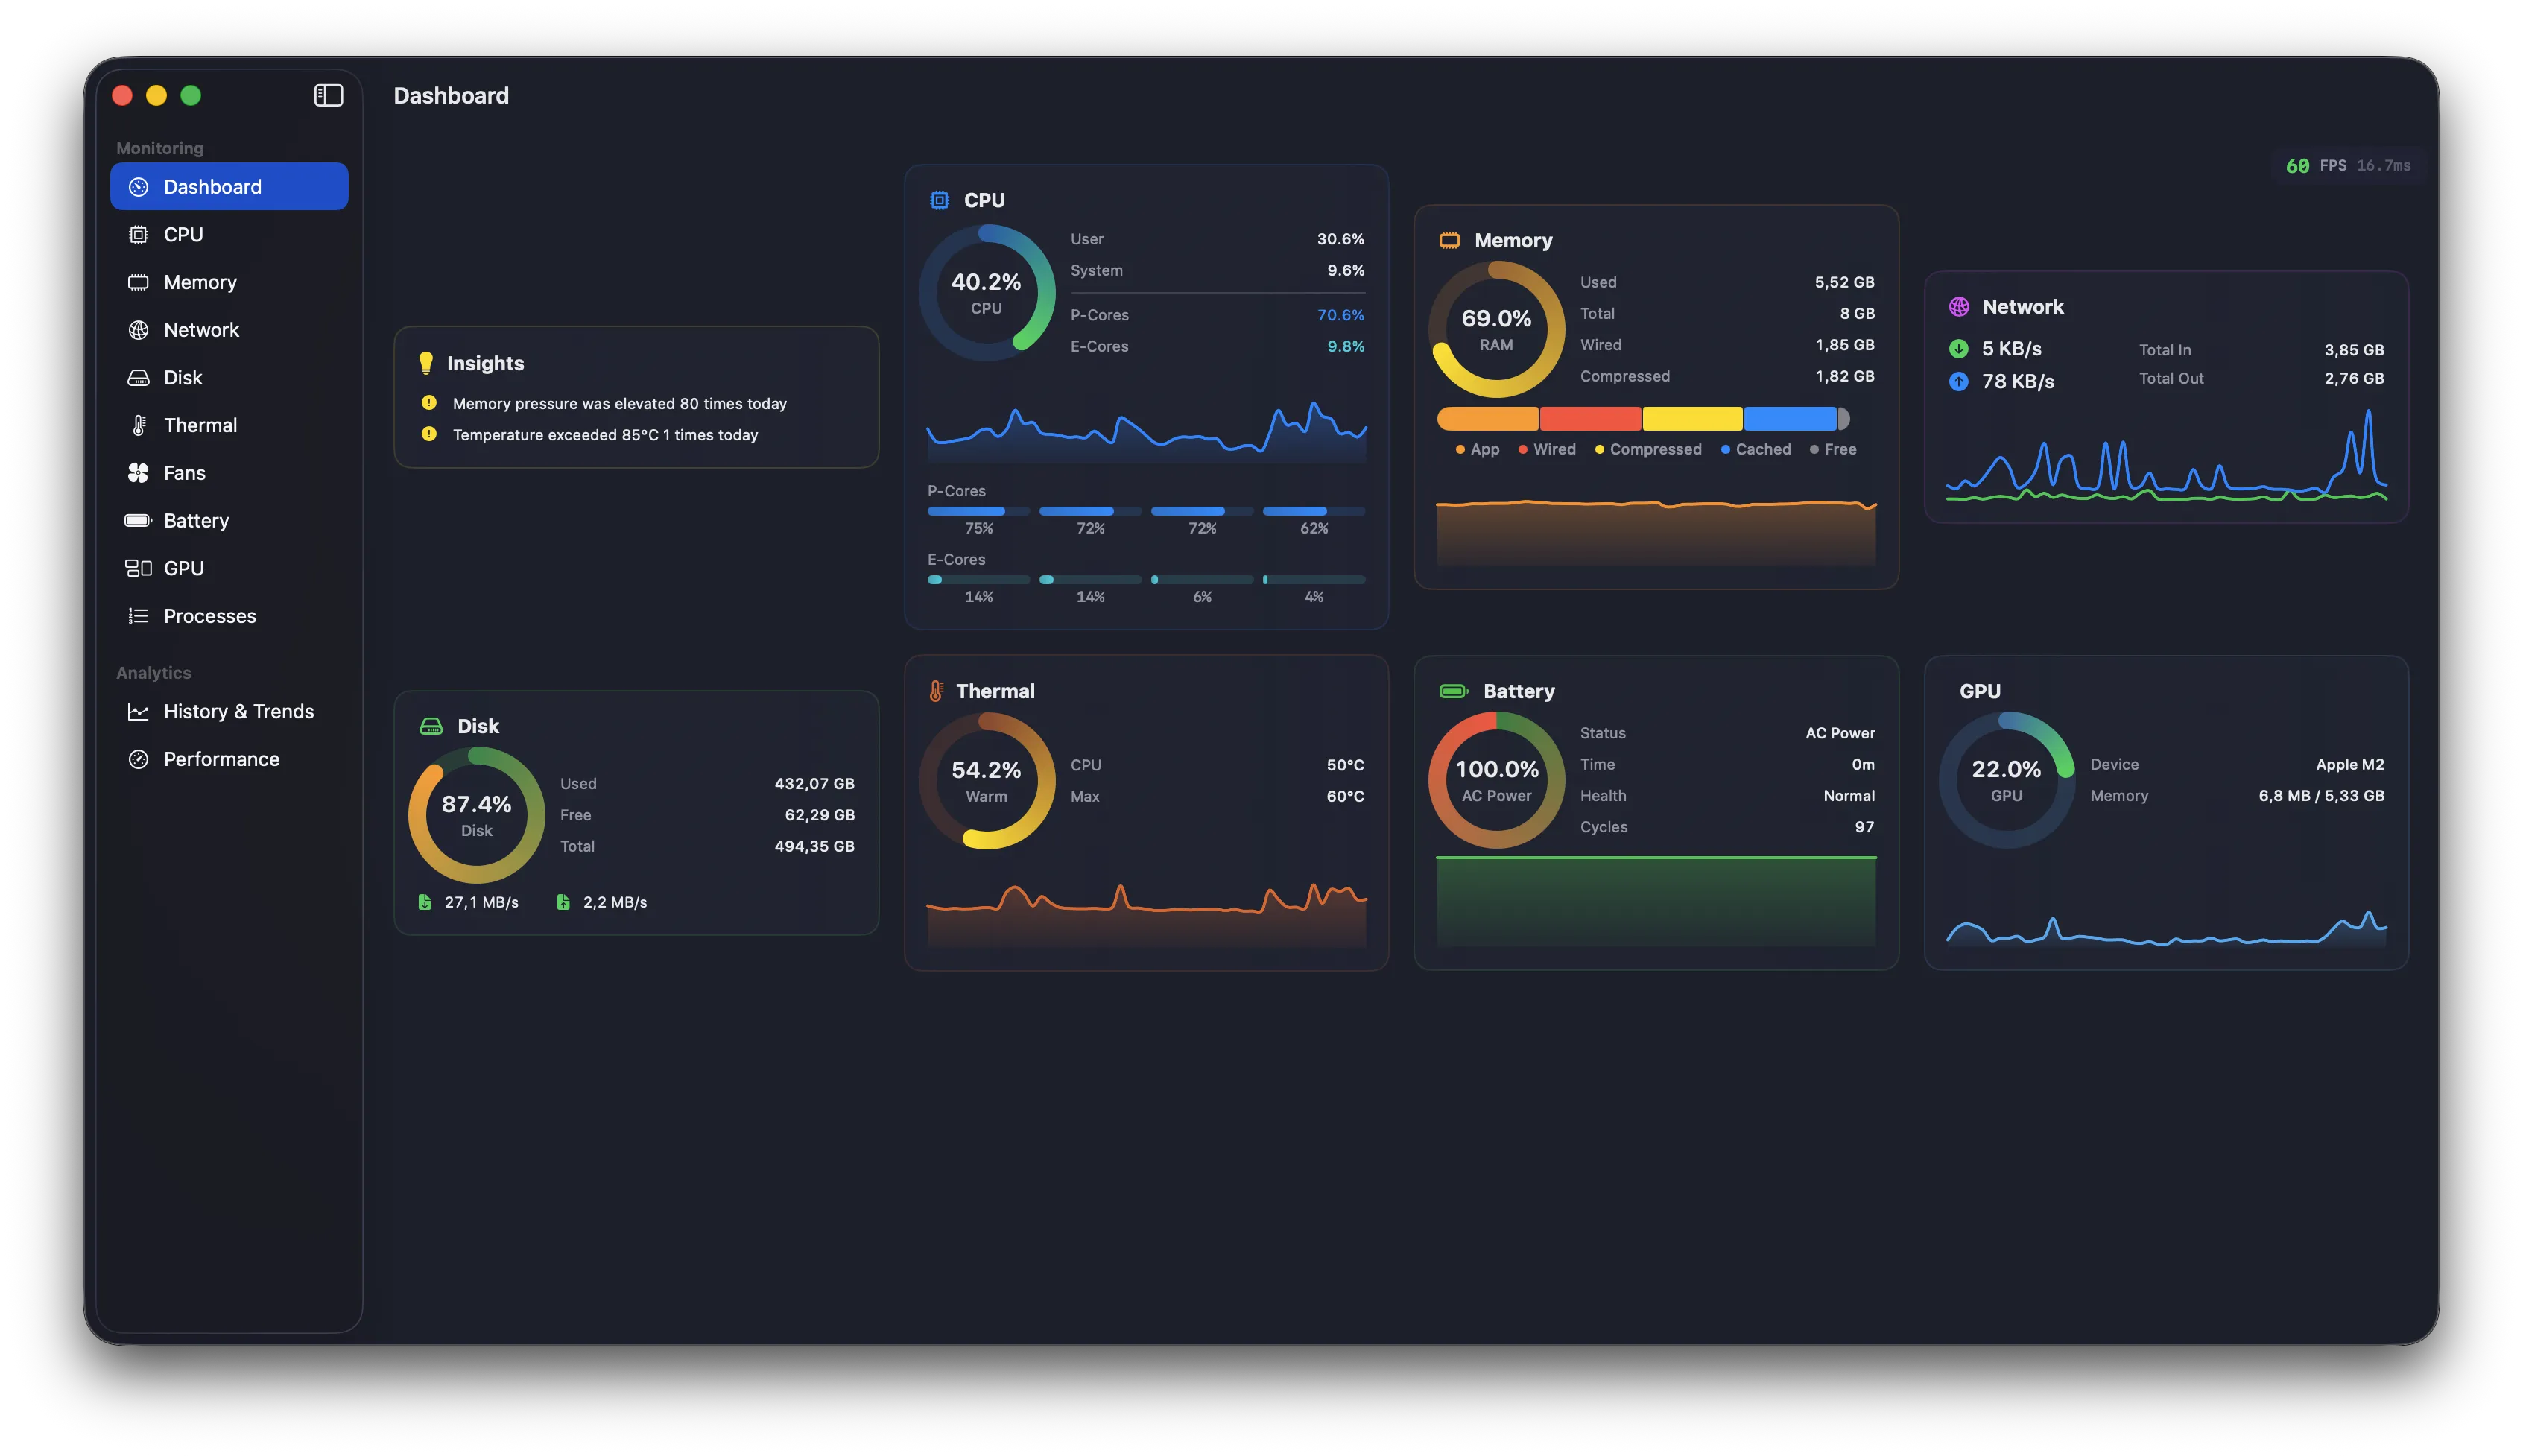
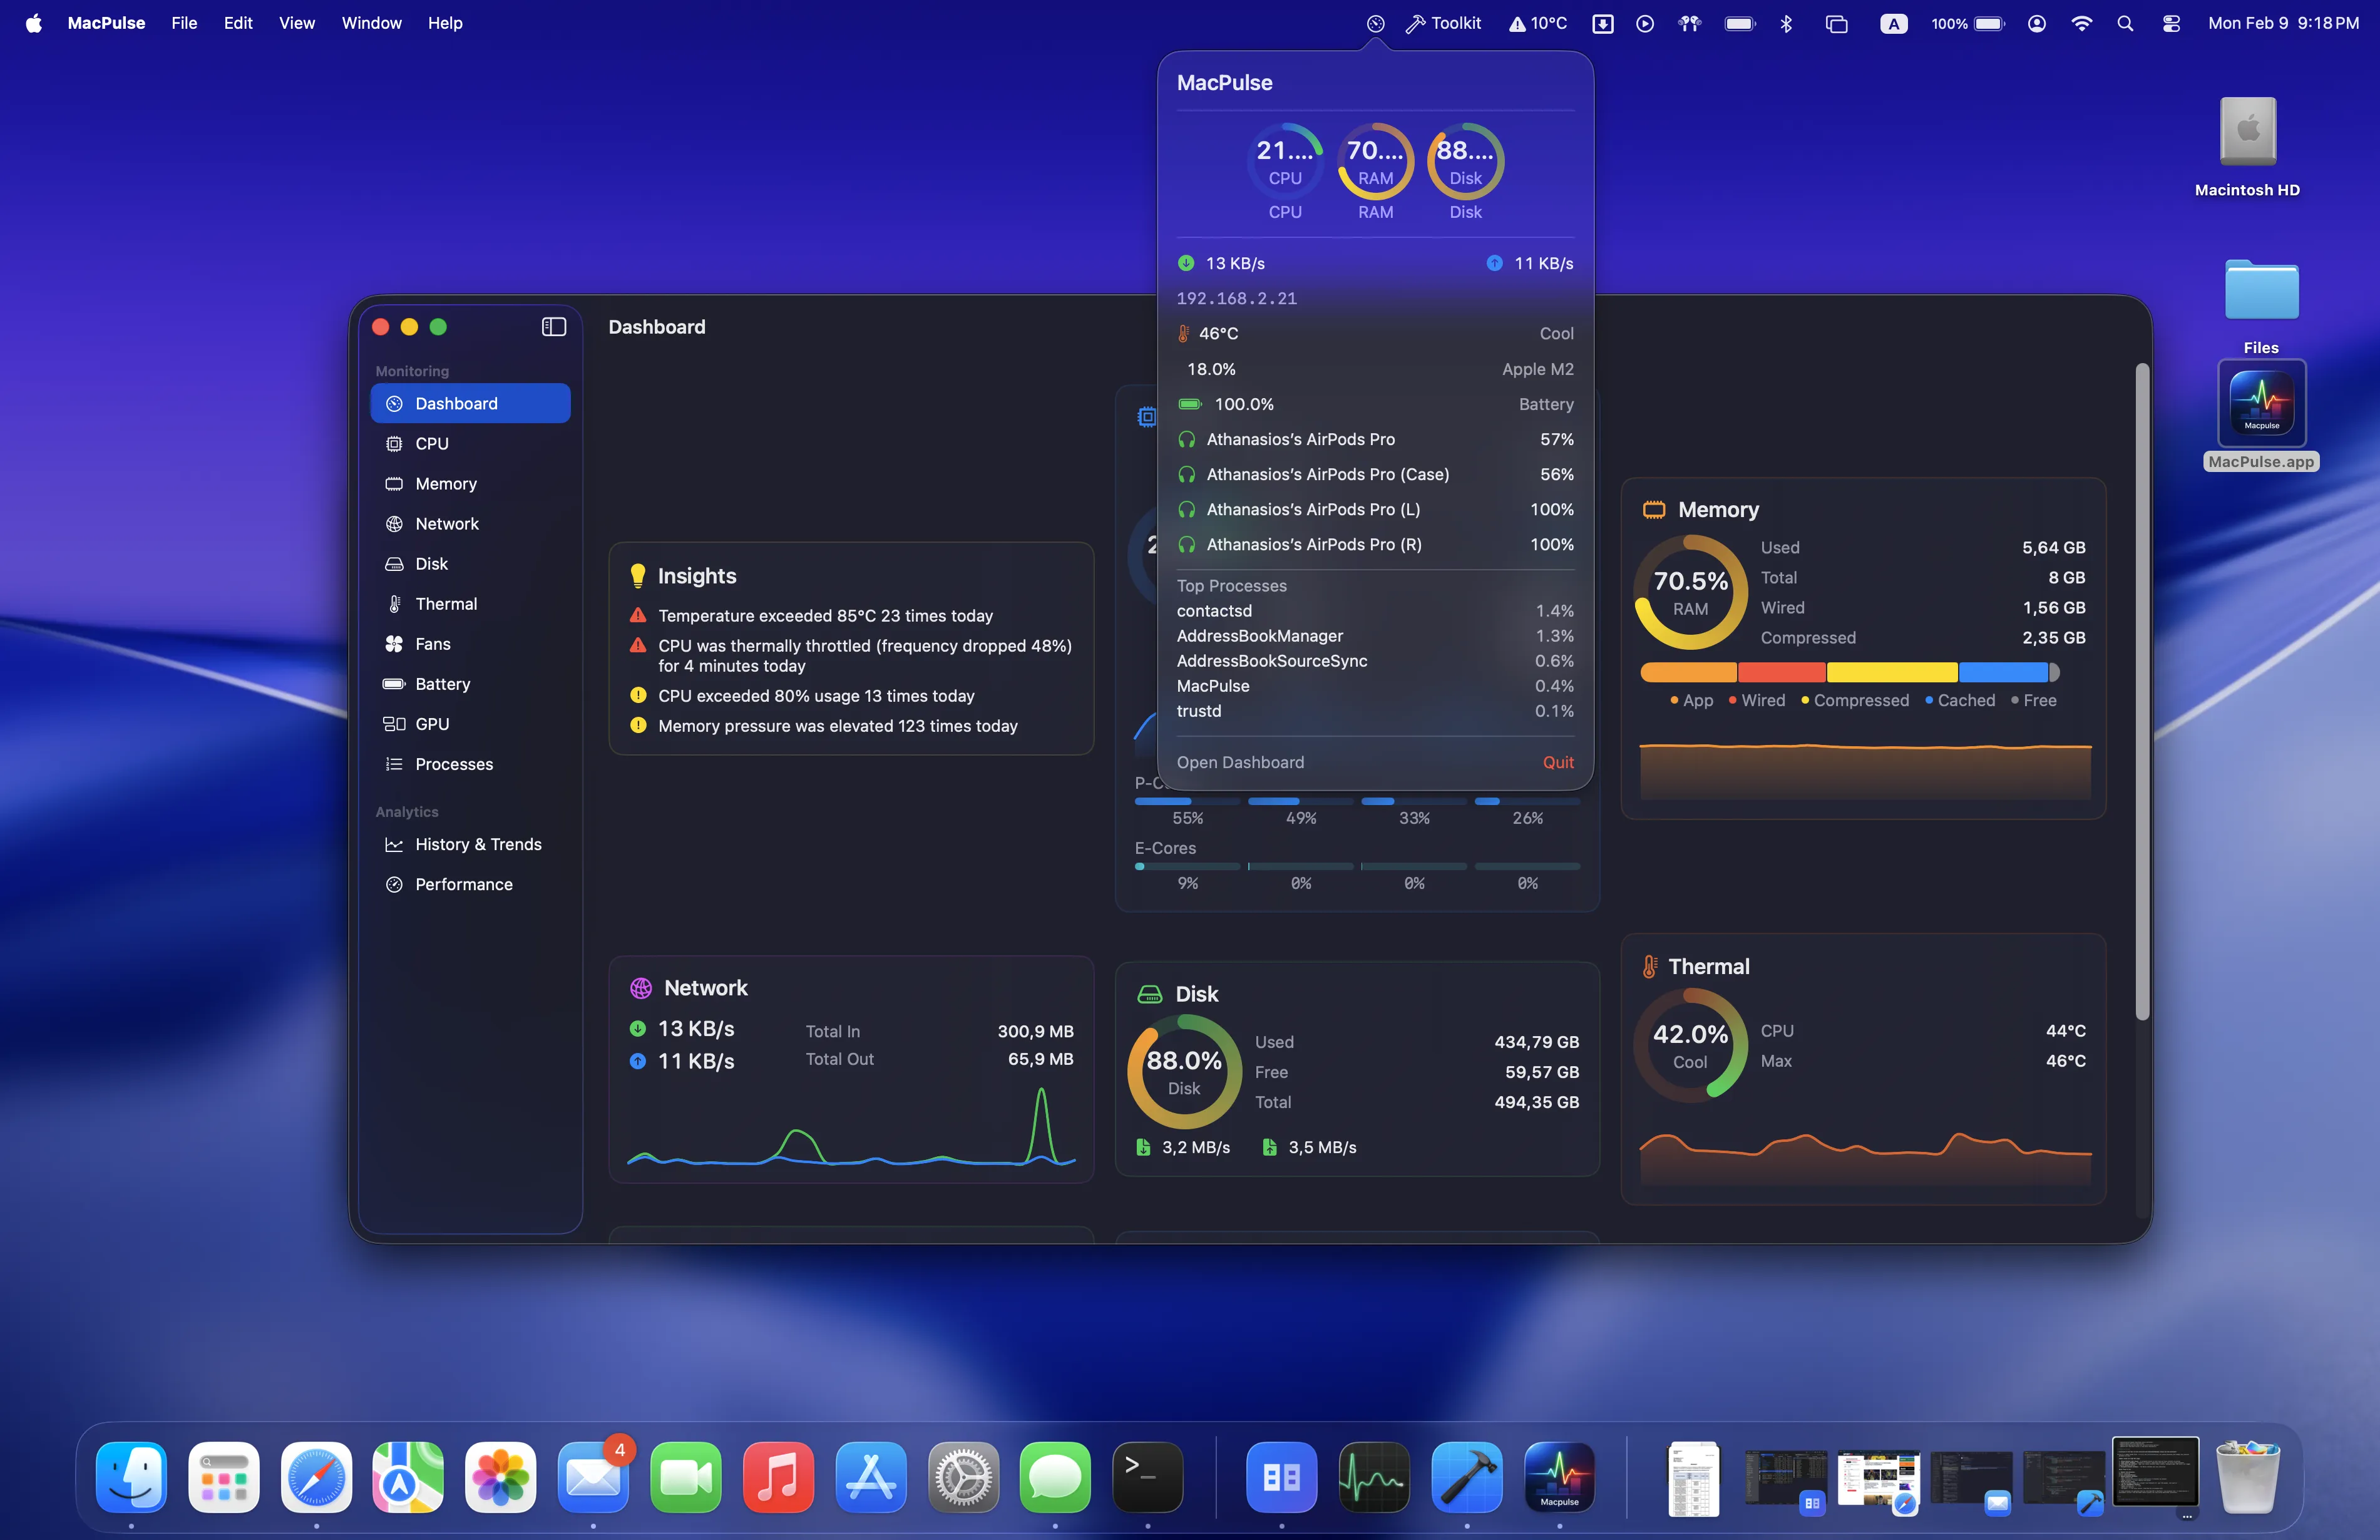
Insights Engine
Your Mac, explained
The Insights Engine analyzes 30 days of historical data to surface patterns and anomalies you'd never spot yourself. Thermal throttling, memory pressure trends, battery drain anomalies, disk growth predictions — all explained in plain English with actionable recommendations.
CPU Throttling Detection
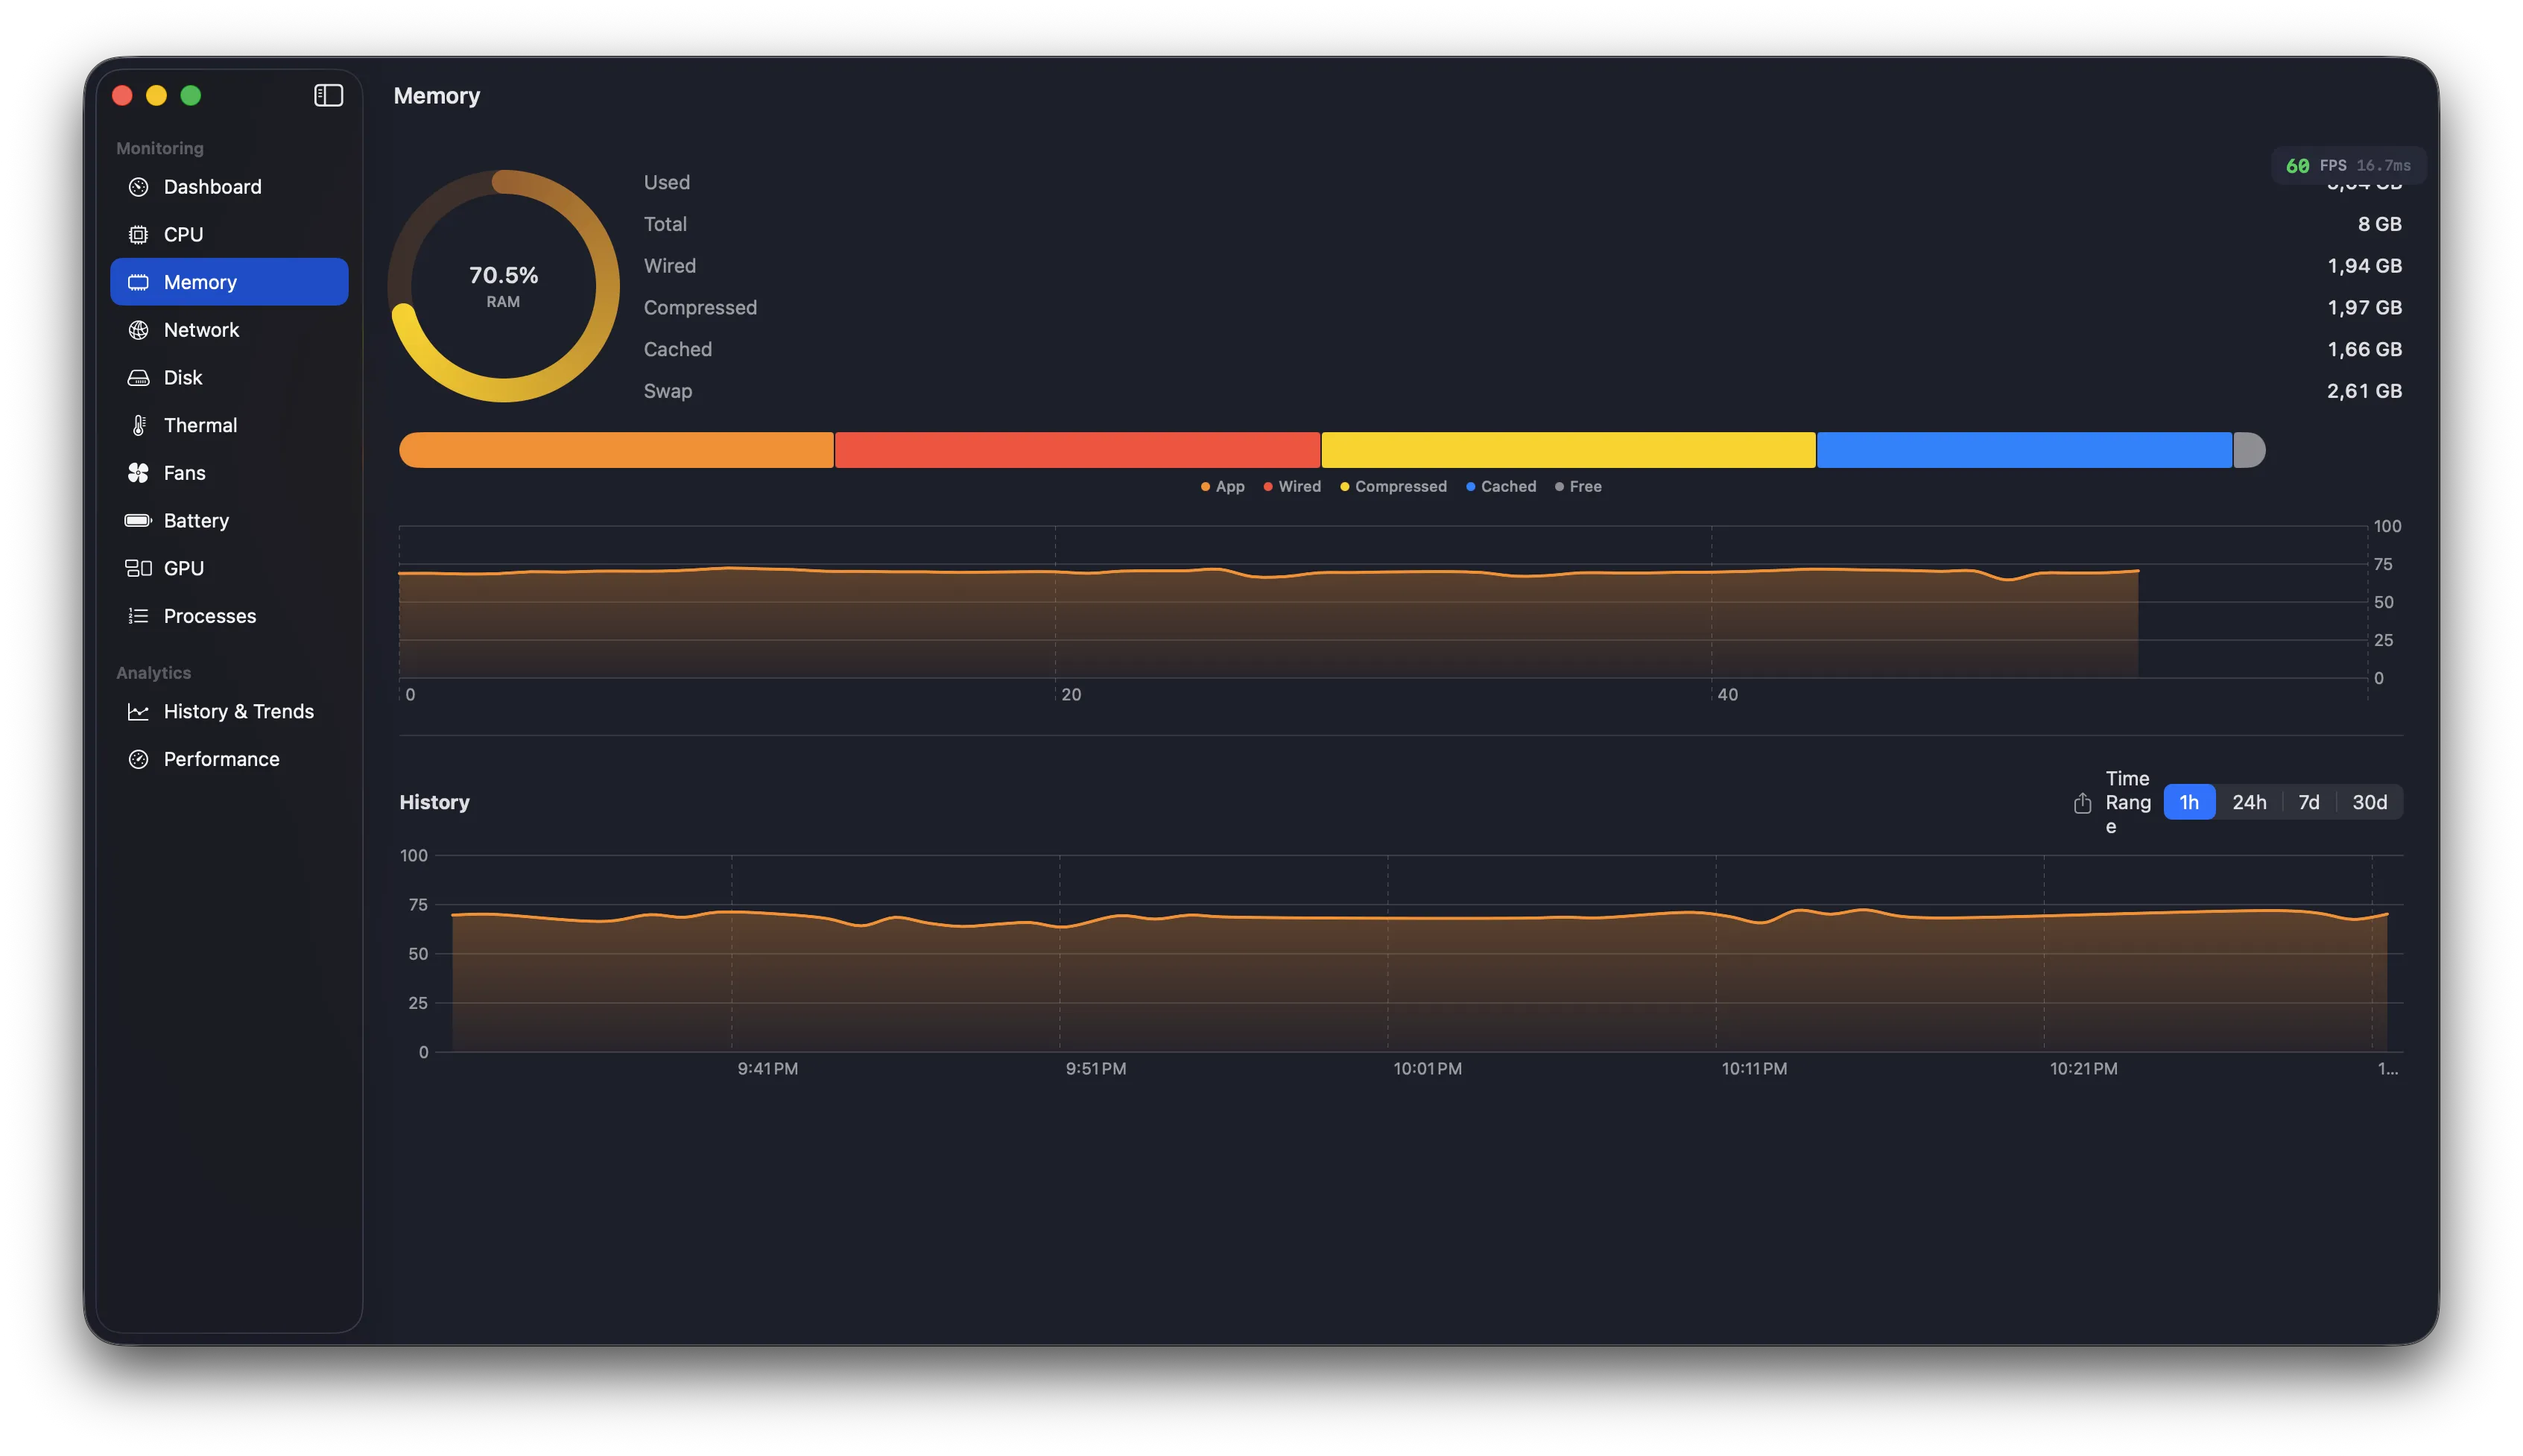
Memory Pressure Tracking
SSD Growth Prediction
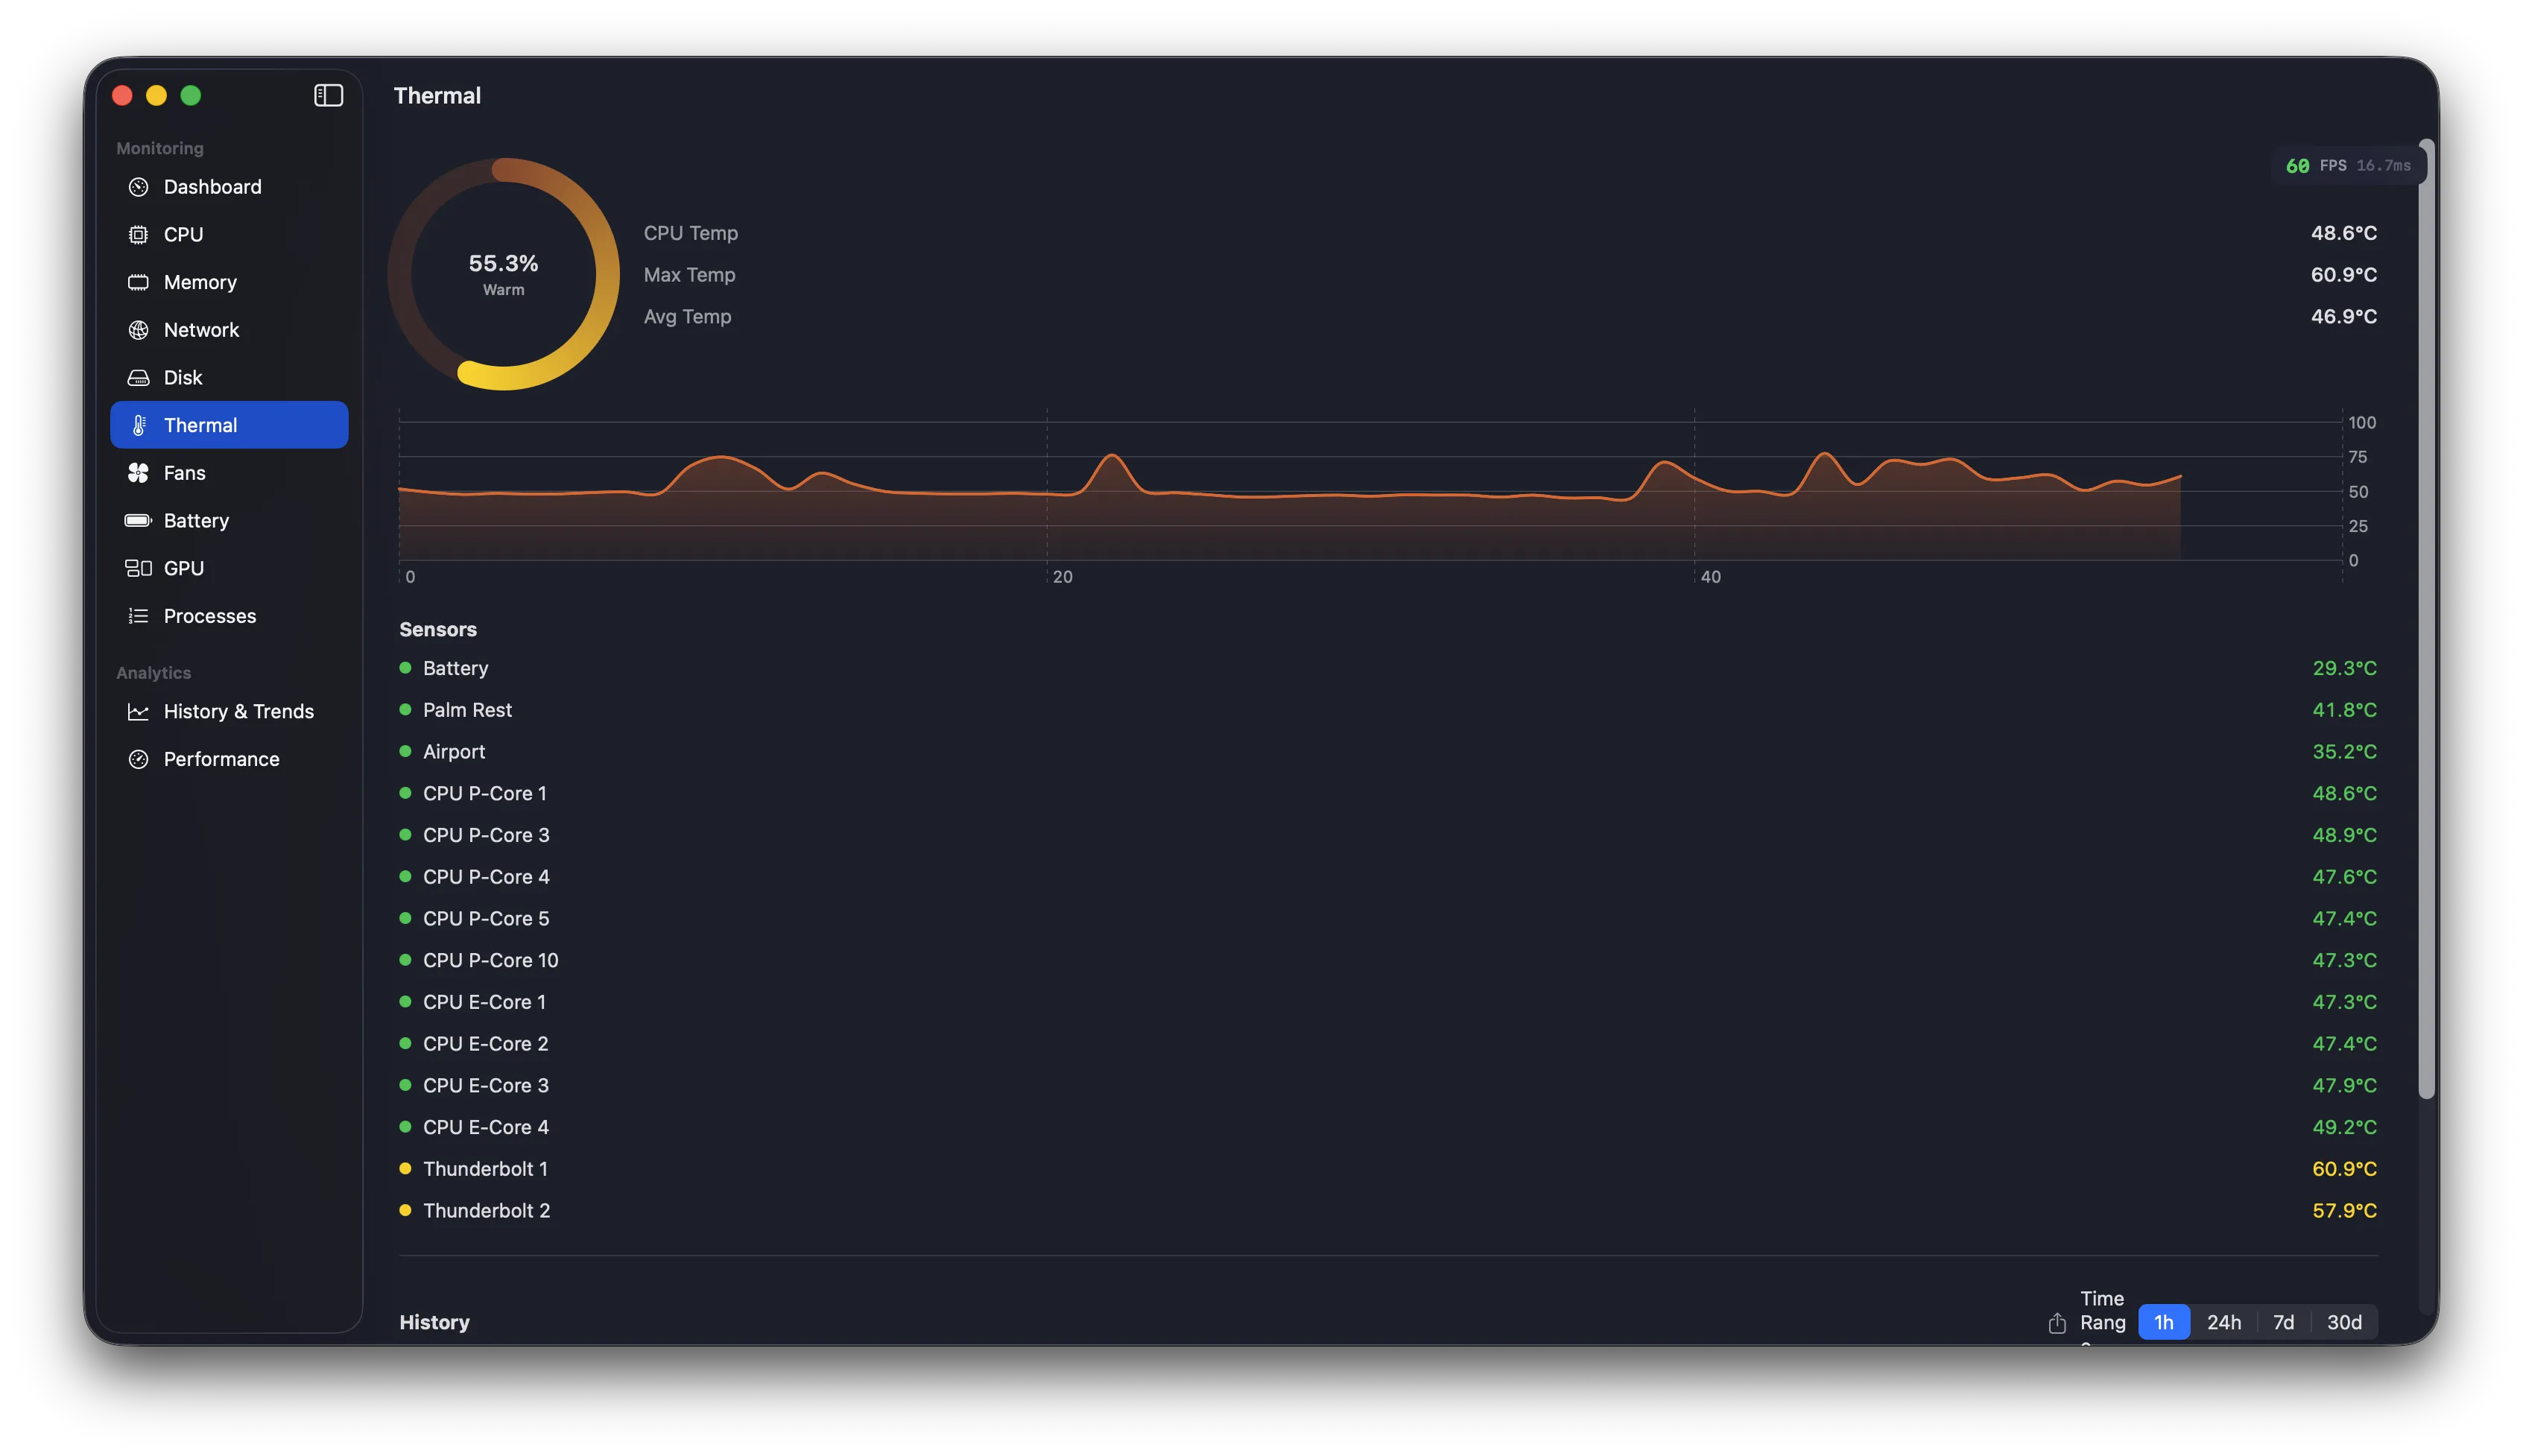
Thermal Event Analysis
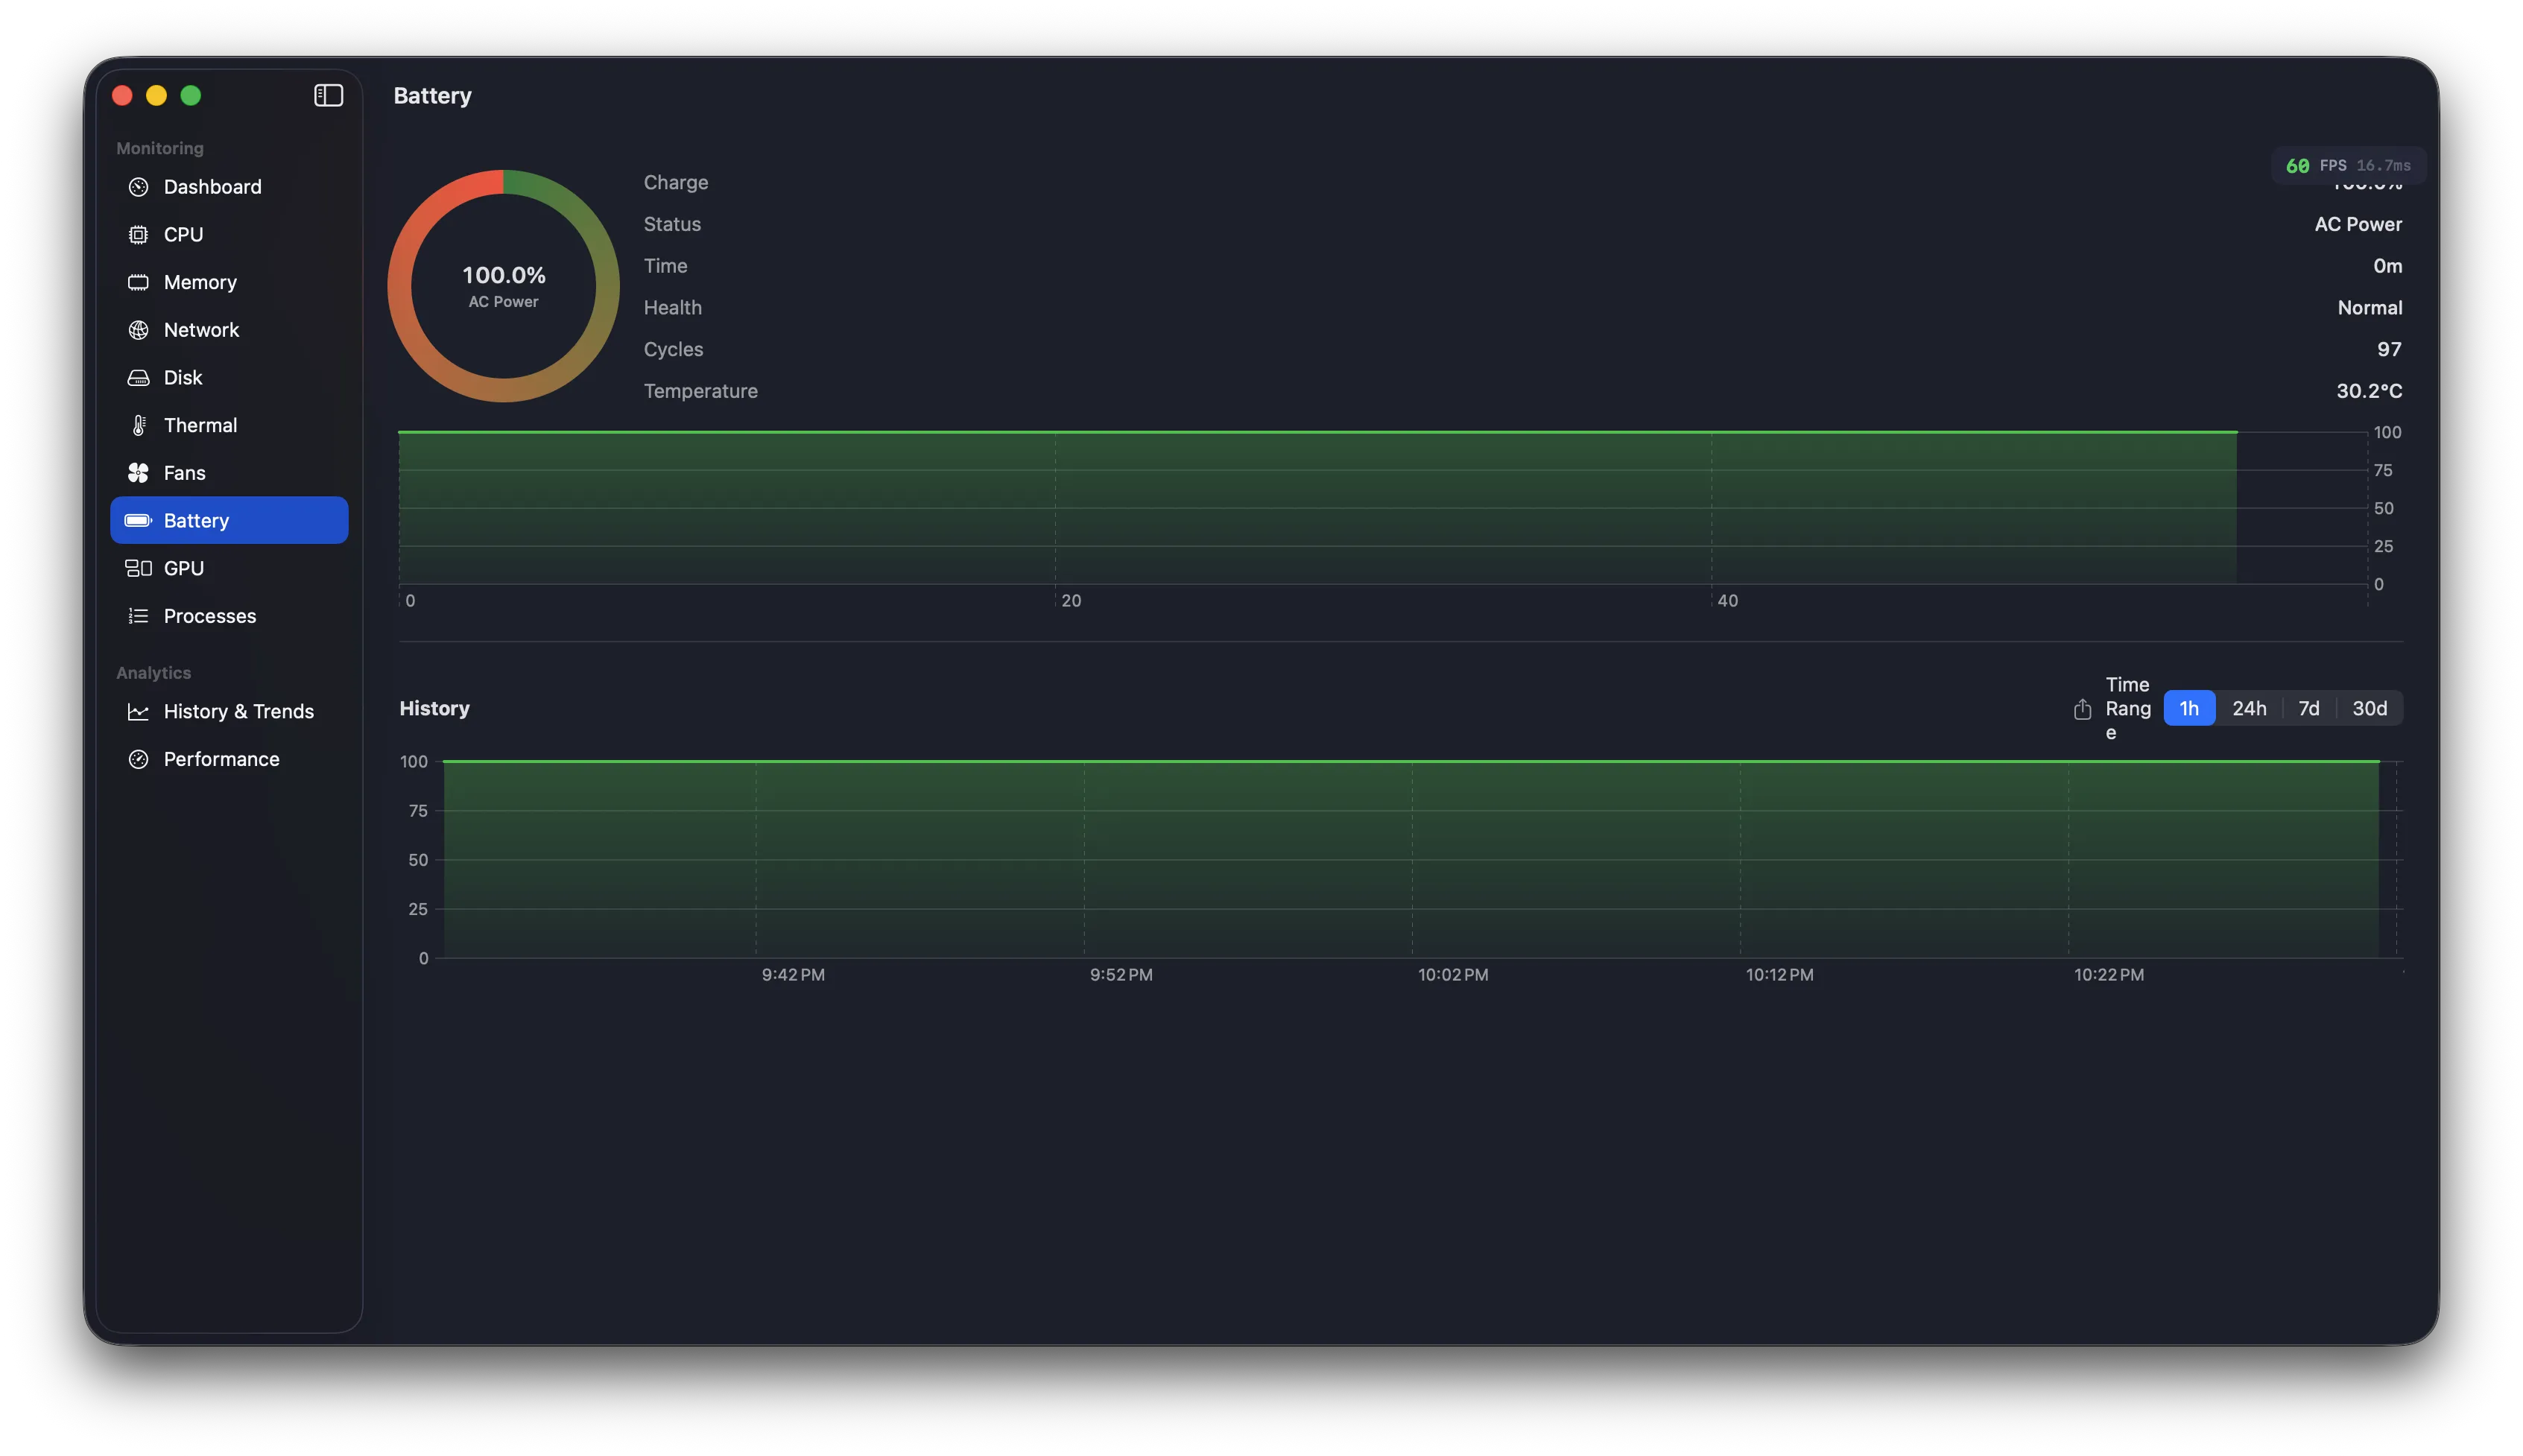
Battery Drain Anomalies
Network Throughput Spikes
Memory — Pressure reached "warning" 4 times today. Week-over-week usage up 8% (62% → 70%).
CPU — Thermal throttling detected: frequency dropped to 78% for 3 min during afternoon compile.
Disk — SSD at 76% capacity. At current growth rate (~2.1 GB/day), ~85 days until performance impact.
Thermal — Fan curve "Performance" reduced avg temp by 12°C. Sustained heat periods down 40%.
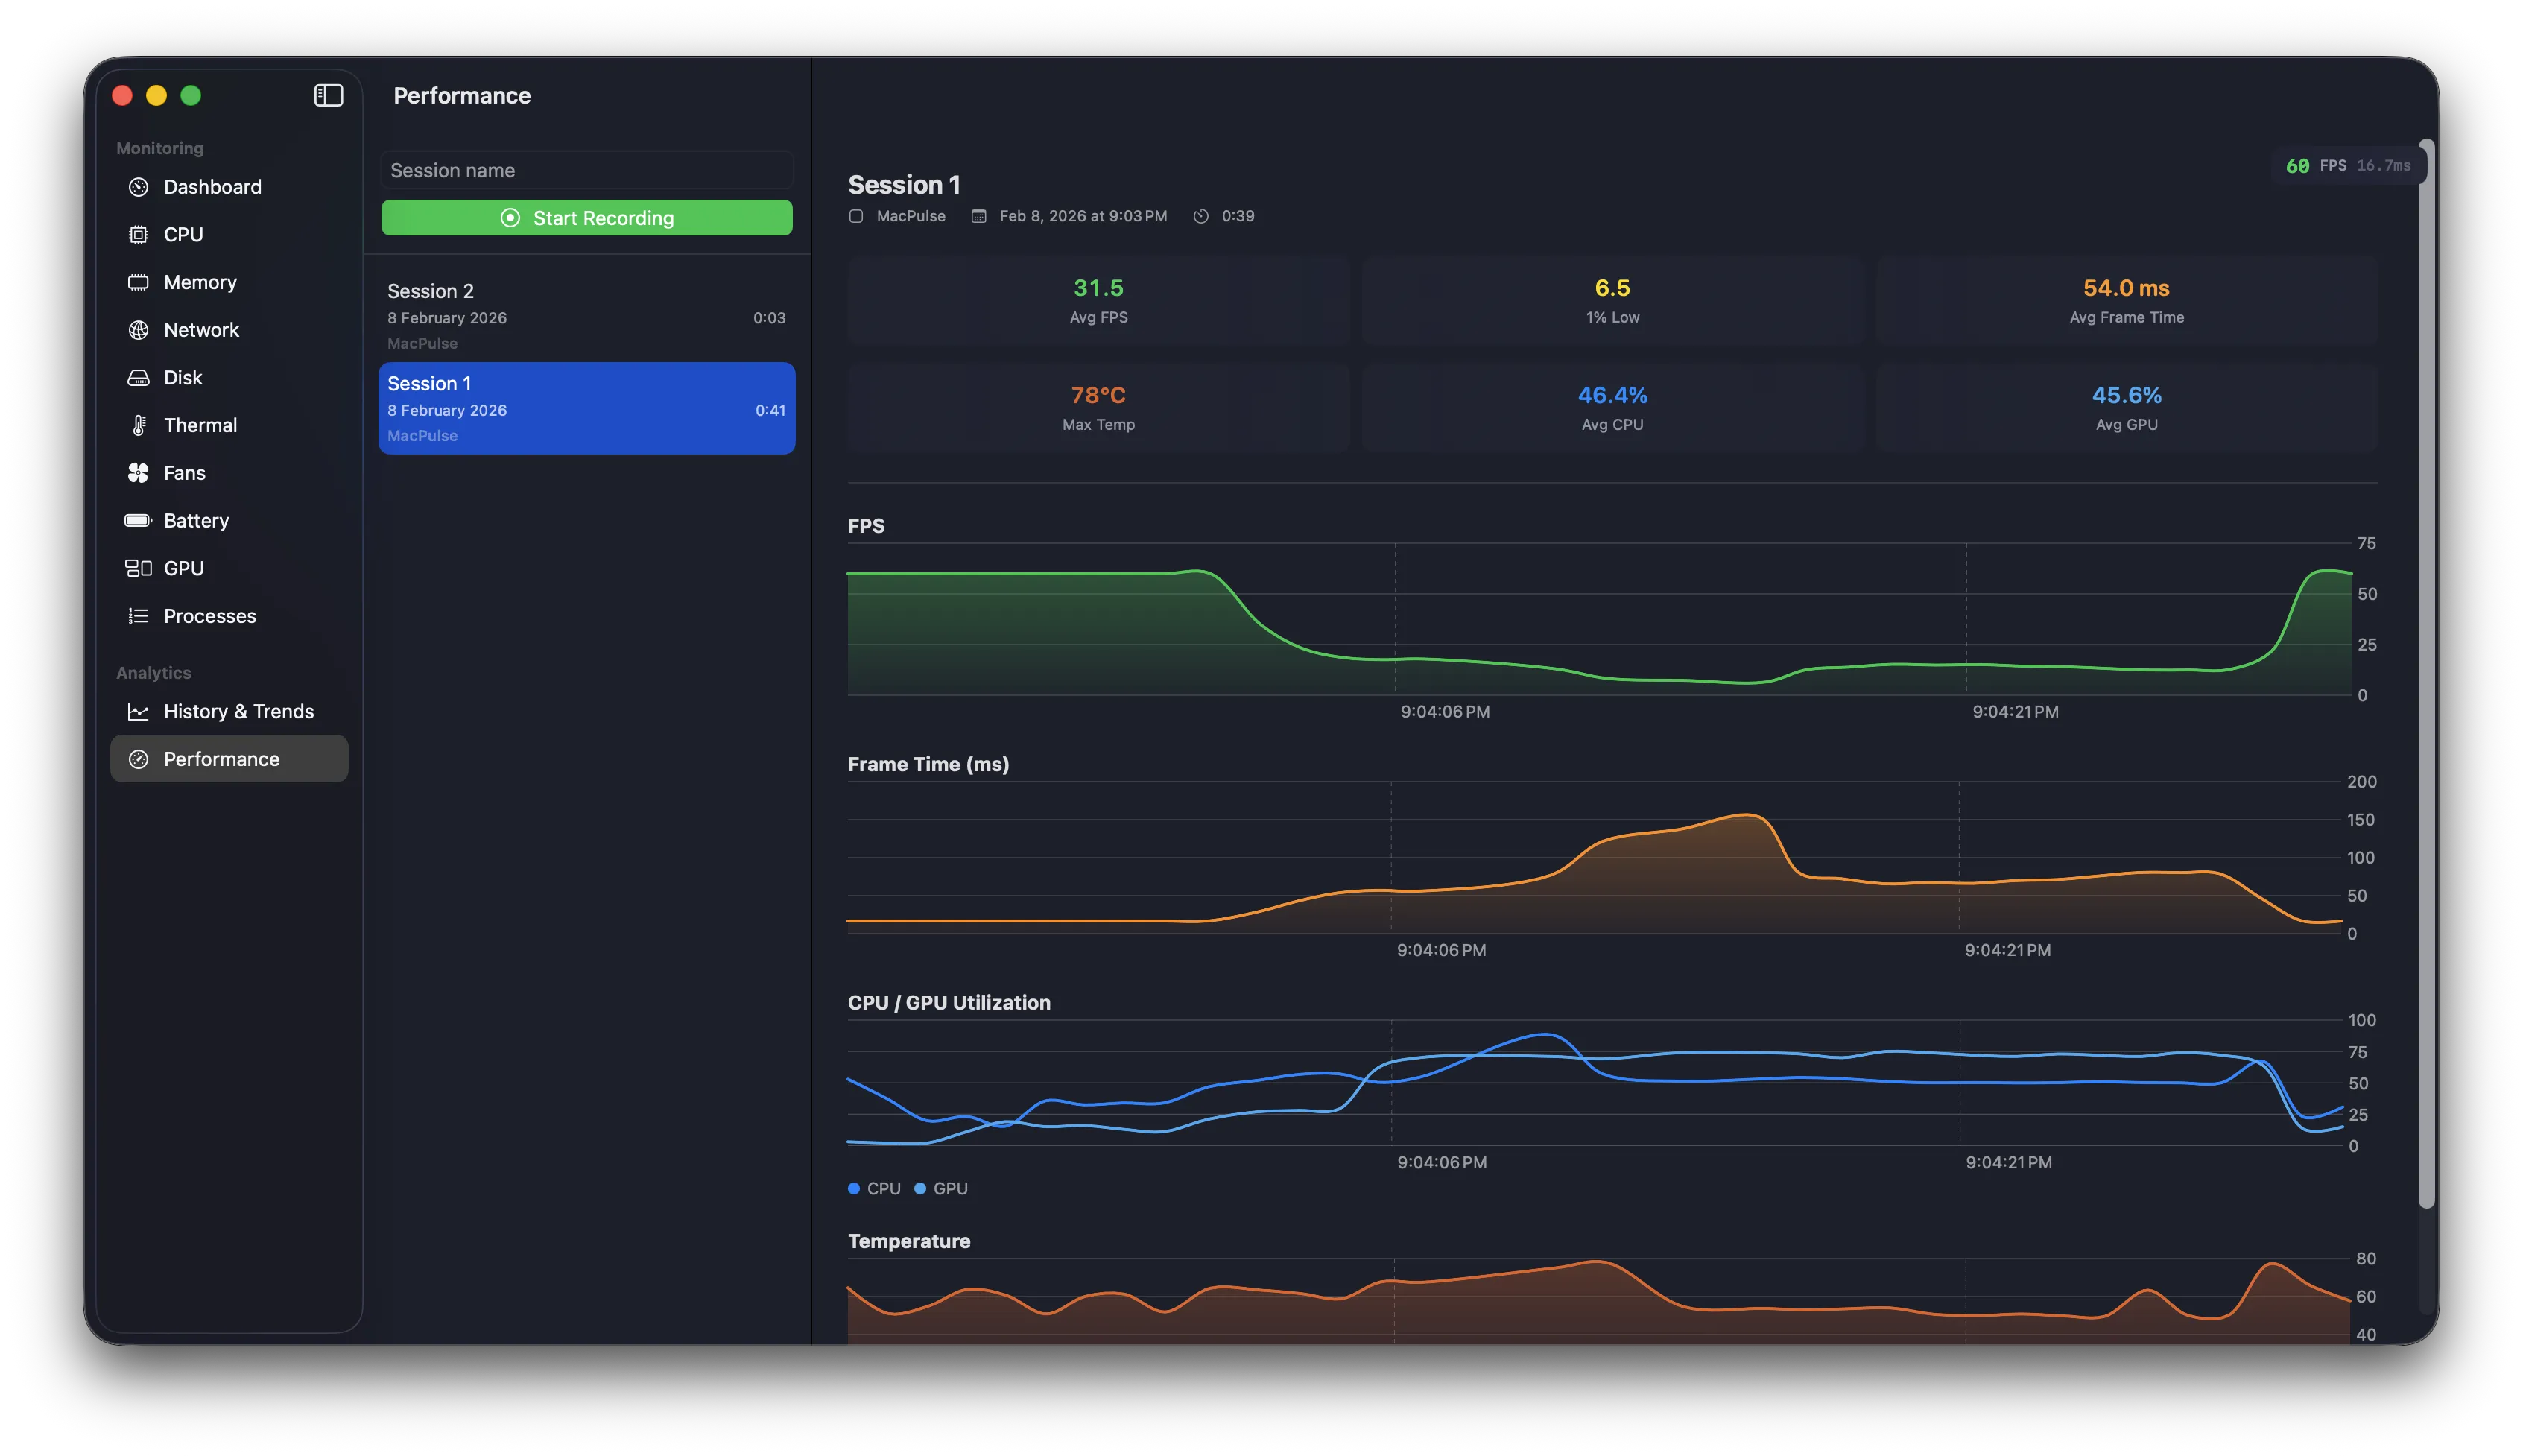
Performance Sessions
Record & analyze
Start a recording session during intensive tasks — gaming, rendering, compiling, or debugging performance issues. Capture comprehensive metrics at 1-second intervals, then analyze the data to find bottlenecks and optimize your workflow.
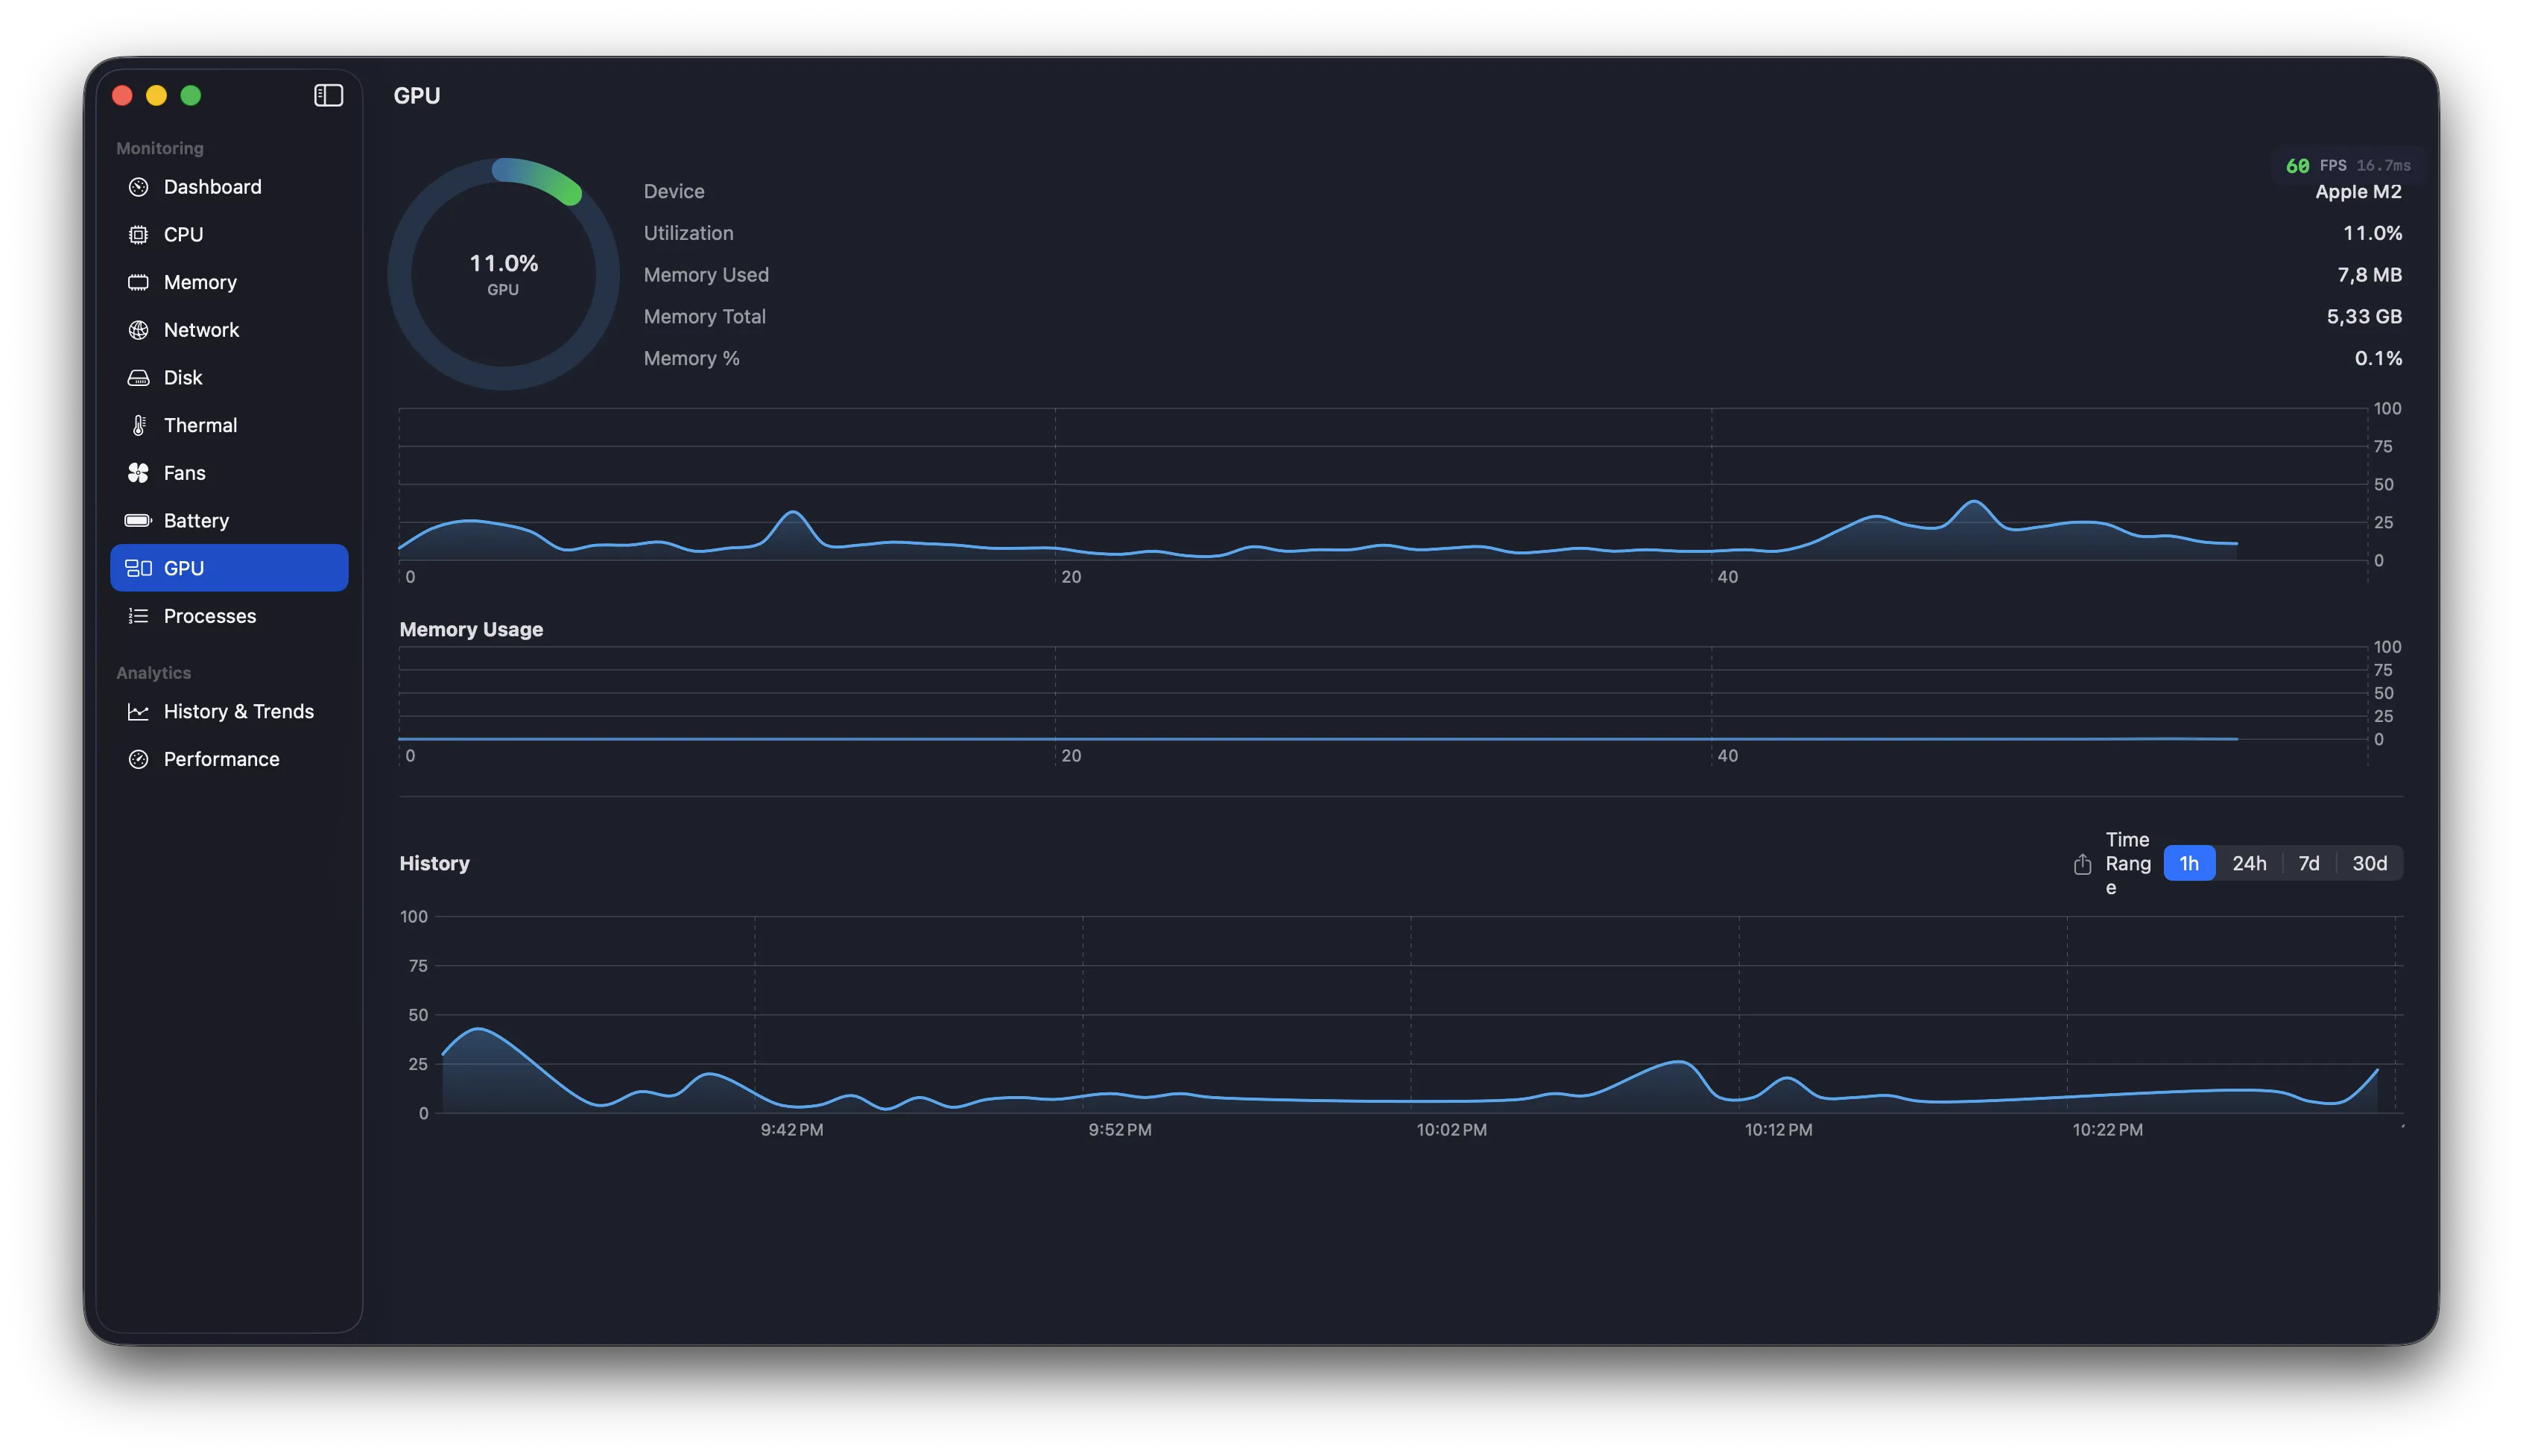
Metrics
CPU, GPU, FPS, Temp
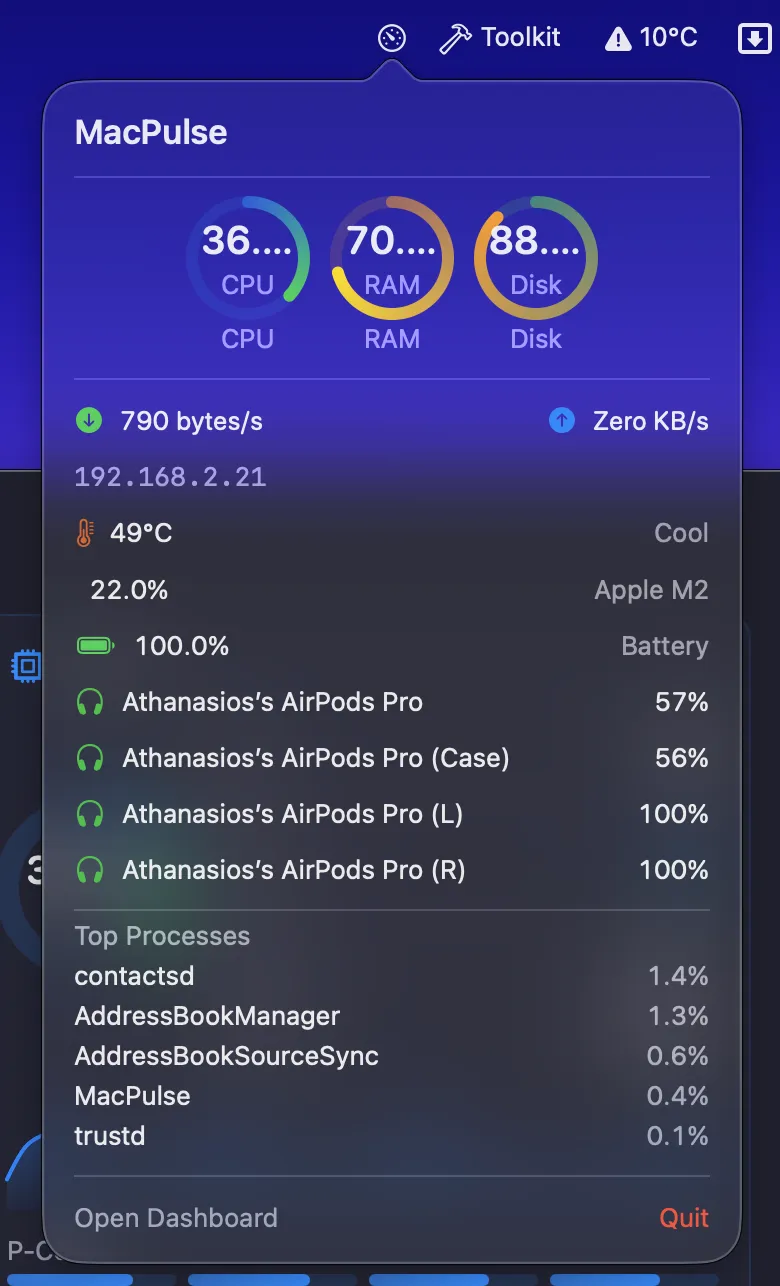
Menu Bar Popover
Compact overview
Click the status item for a complete system overview. Mini gauges for CPU, Memory, Disk. Network throughput with private IP. Thermal status, GPU utilization, battery level, and Bluetooth device batteries.
Bluetooth Batteries
Every accessory
Track battery levels for AirPods (Left/Right/Case), Magic Mouse, Magic Keyboard, trackpads, and game controllers. Low battery warnings highlighted in red.
🎧
AirPods Pro
L 85% R 82% C 45%
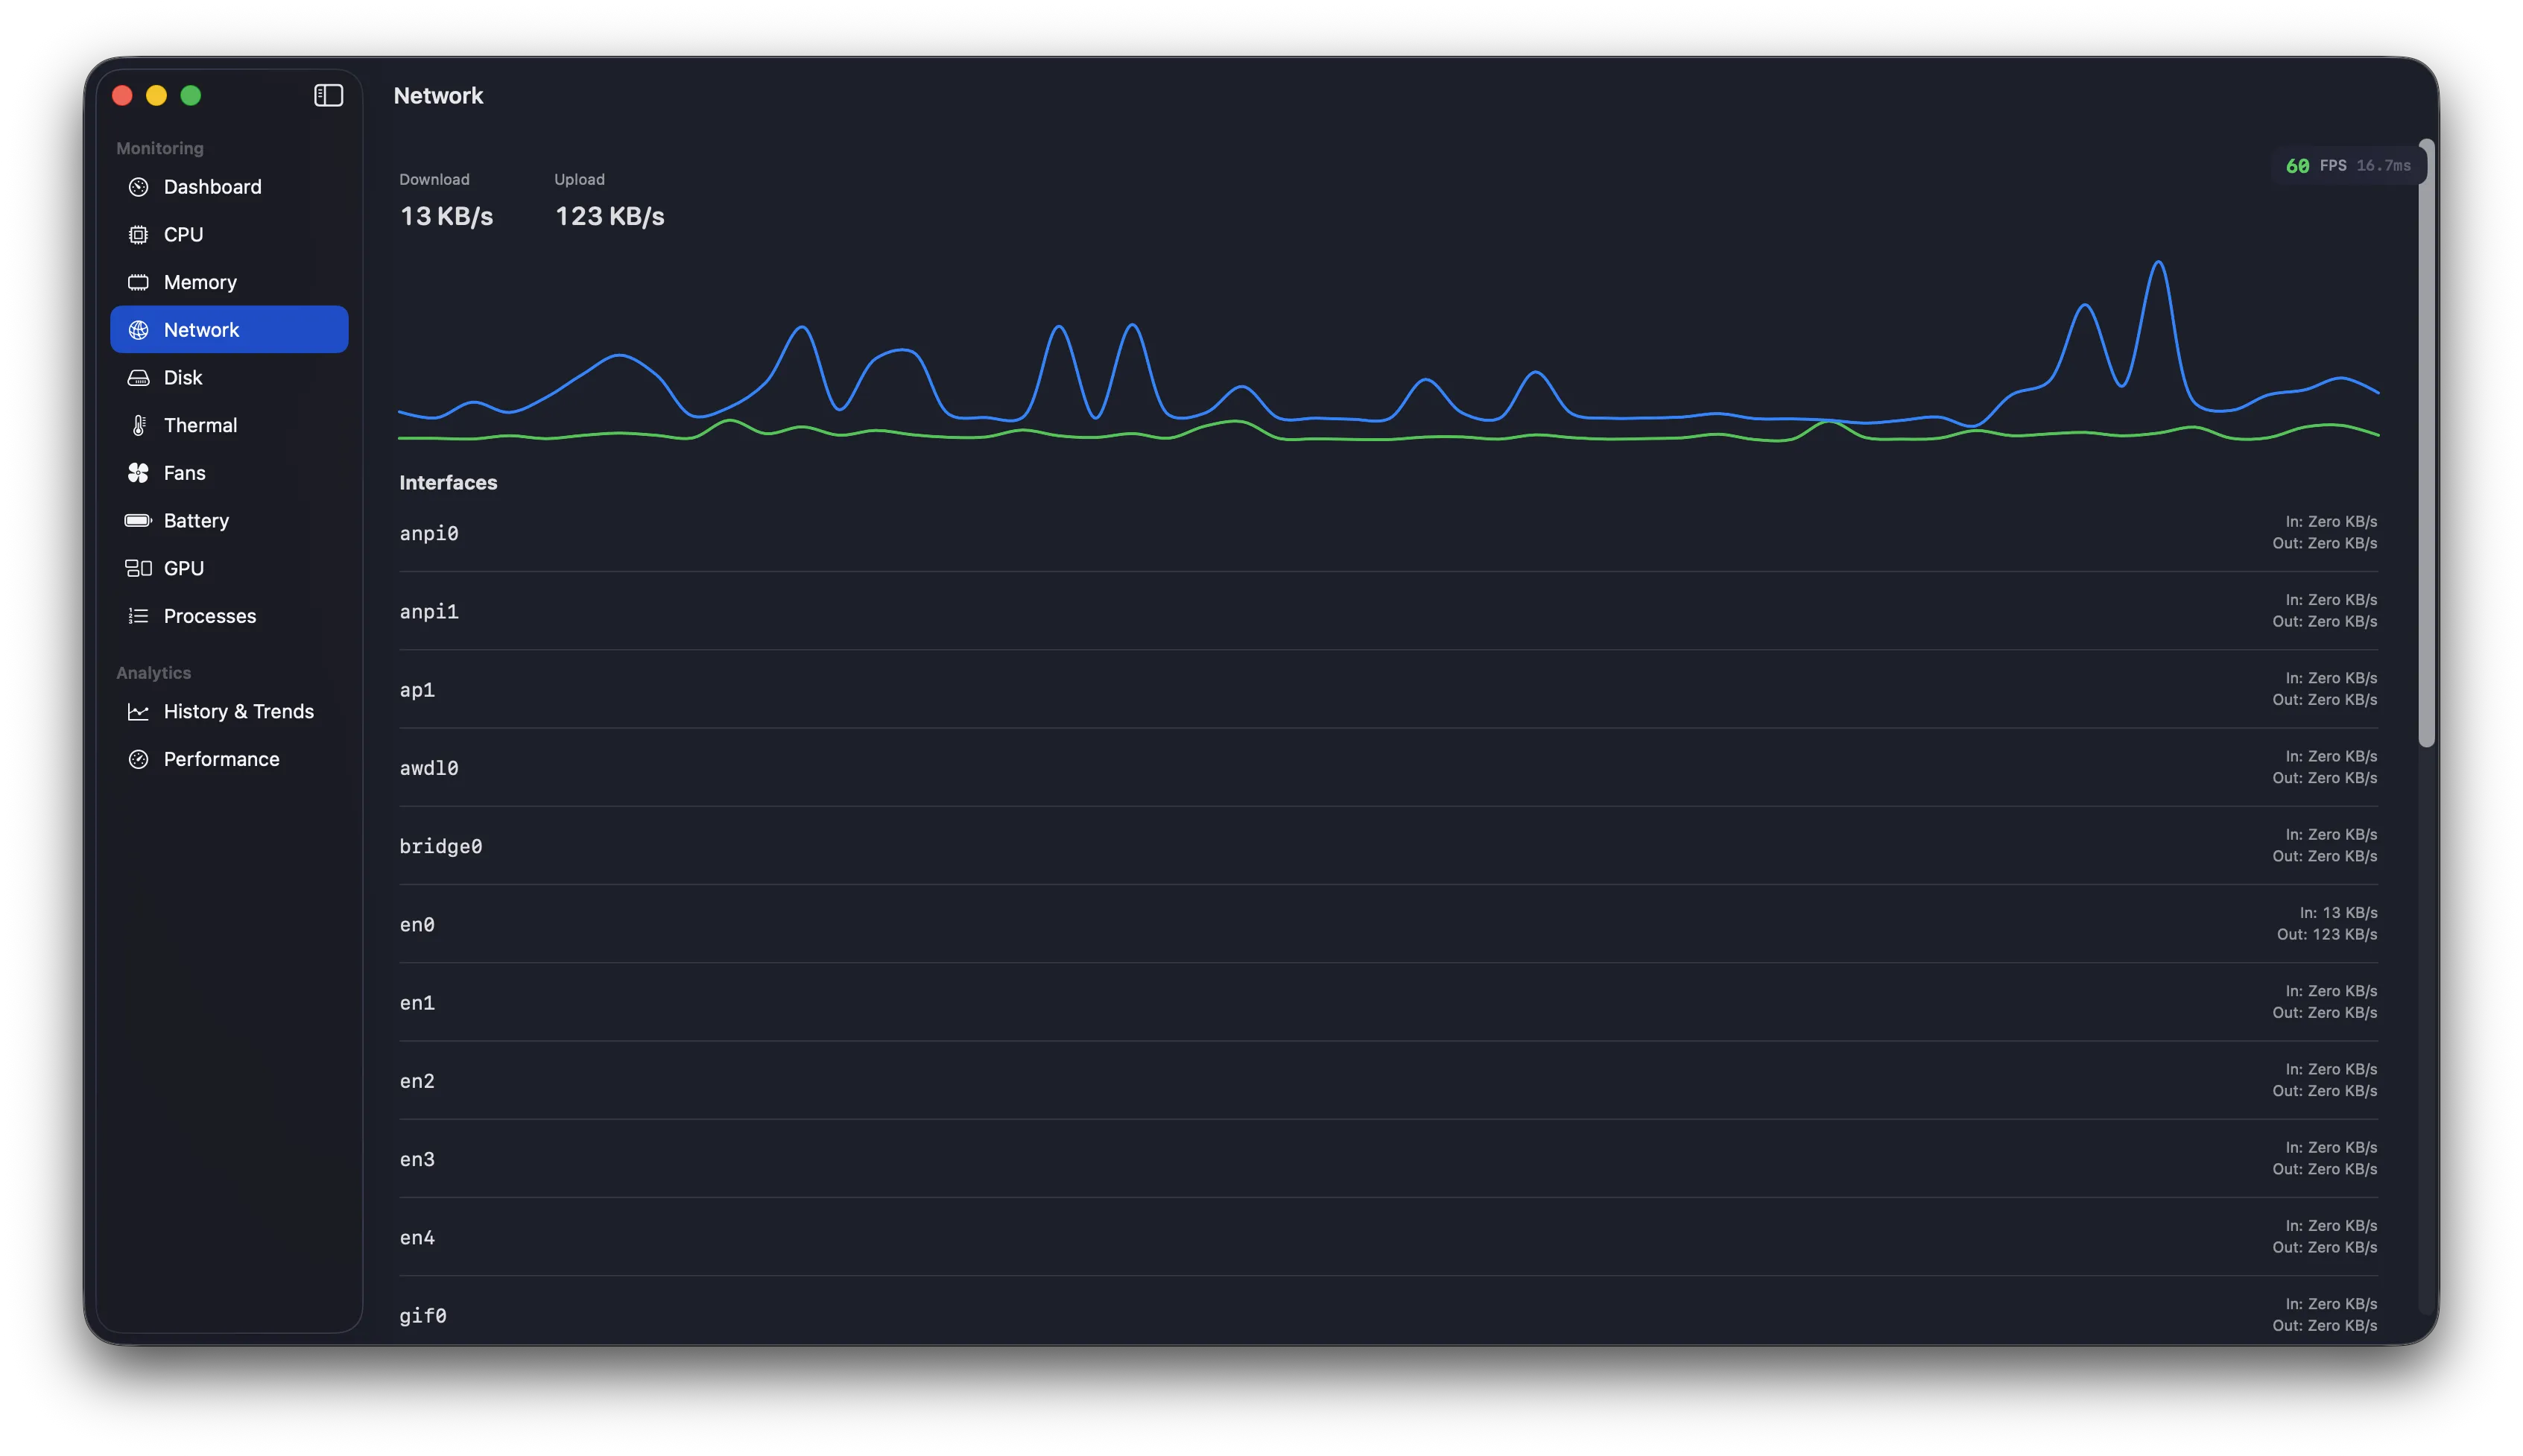
Network Intelligence
IP & alerts
Private and public IP addresses displayed in the popover. Get notified when your IP changes or connectivity drops.
Private IP
192.168.1.42
Public IP
203.0.113.1
SMART Health
Disk vitals
Monitor SMART status for NVMe and SATA drives. Verified, Failing, or Unknown indicators with media type detection.
Power Sensors
Real-time watts
SMC power readings: system total, CPU, GPU, memory, and DC input. Voltage and current for advanced diagnostics.
Top Processes
What's eating your CPU
Real-time delta-based measurement shows actual current CPU usage (not lifetime average). Top 5 processes by CPU in the menu bar popover, refreshed each time you open it.
Per-App Breakdown
Who's using your bandwidth
See which apps are consuming the most network bandwidth and disk I/O. Top 10 apps aggregated by process name with delta-based measurement.
#1
Chrome
↓ 4.2 MB/s
↑ 890 KB/s
#2
Dropbox
↓ 1.8 MB/s
↑ 2.1 MB/s
#3
Spotify
↓ 320 KB/s
↑ 12 KB/s
Extended Notifications
Never miss a warning
Comprehensive alerts for GPU utilization, GPU temperature, low battery, fan failure, and fans at max. Each with configurable thresholds and 15-minute cooldowns.
GPU temperature exceeded 90°C
Battery below 20% on battery power
GPU sustained above 90% for 5 min